Overview
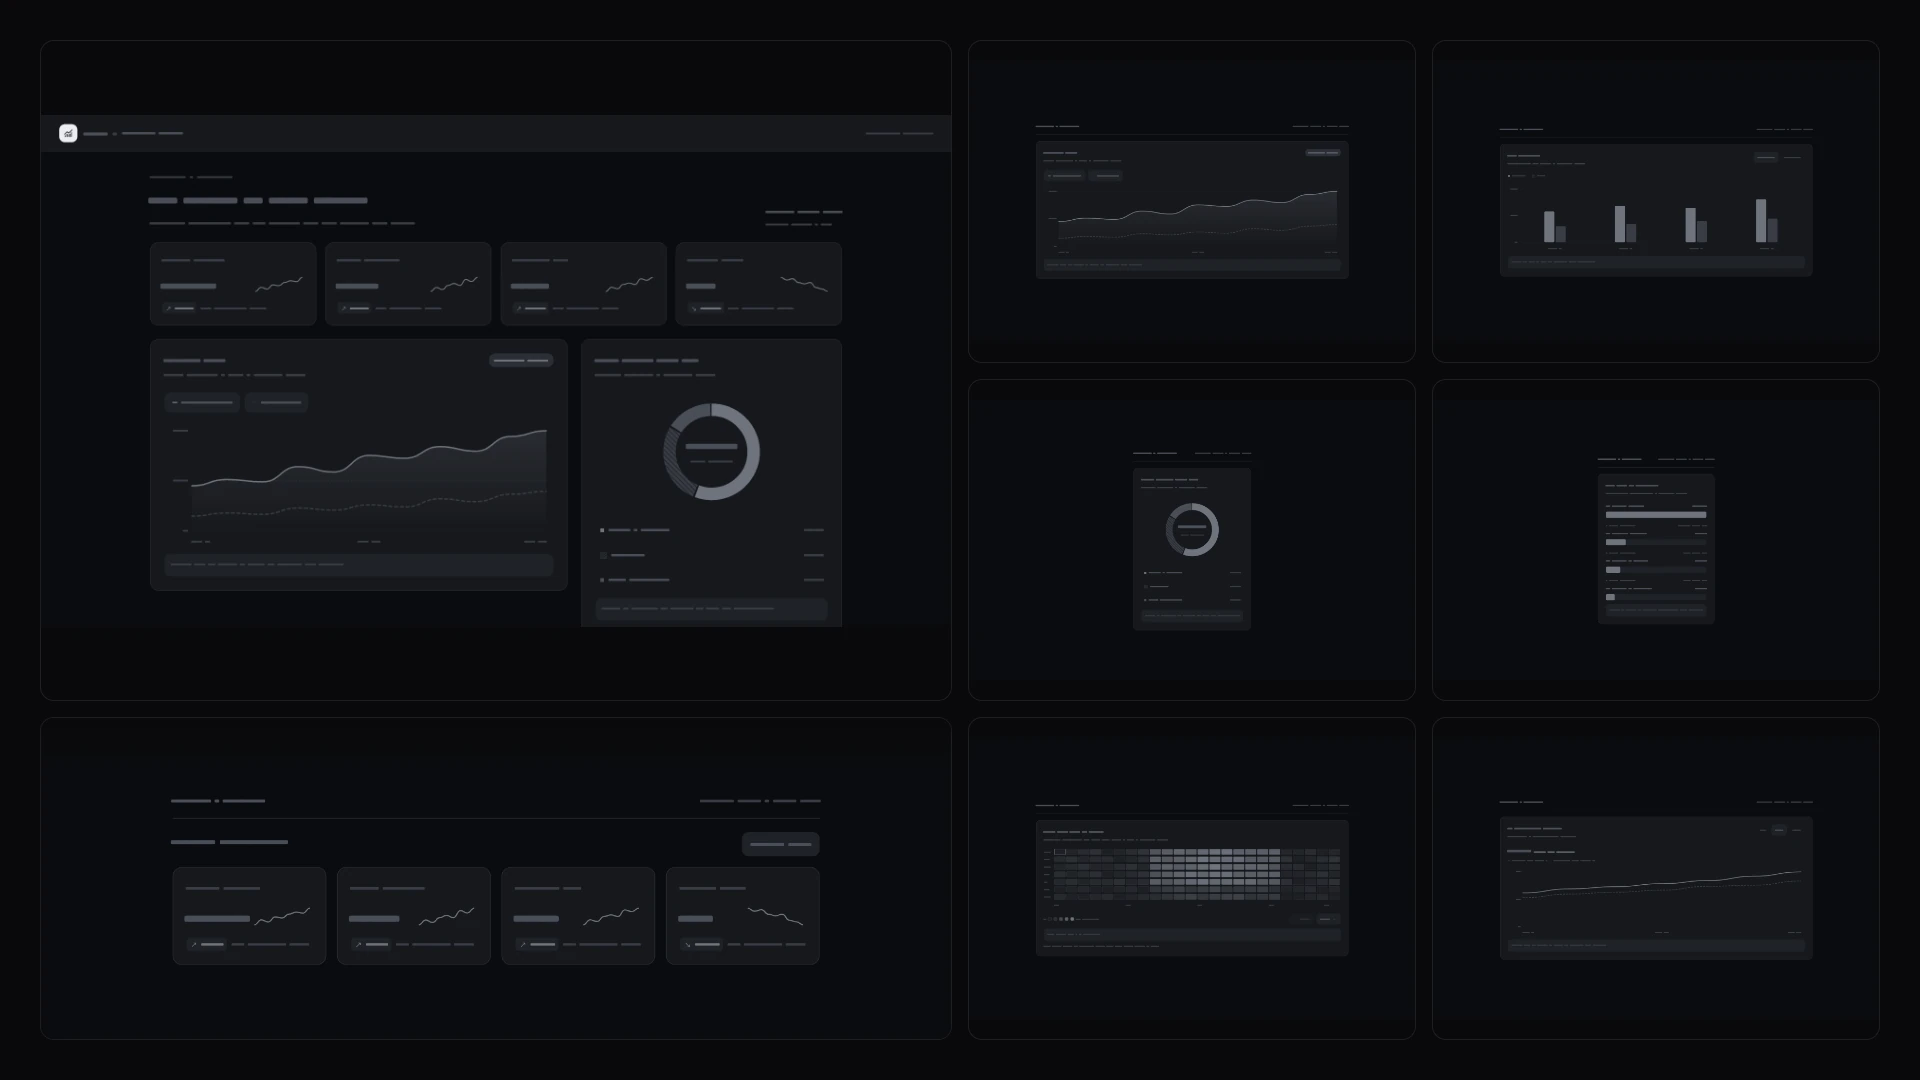
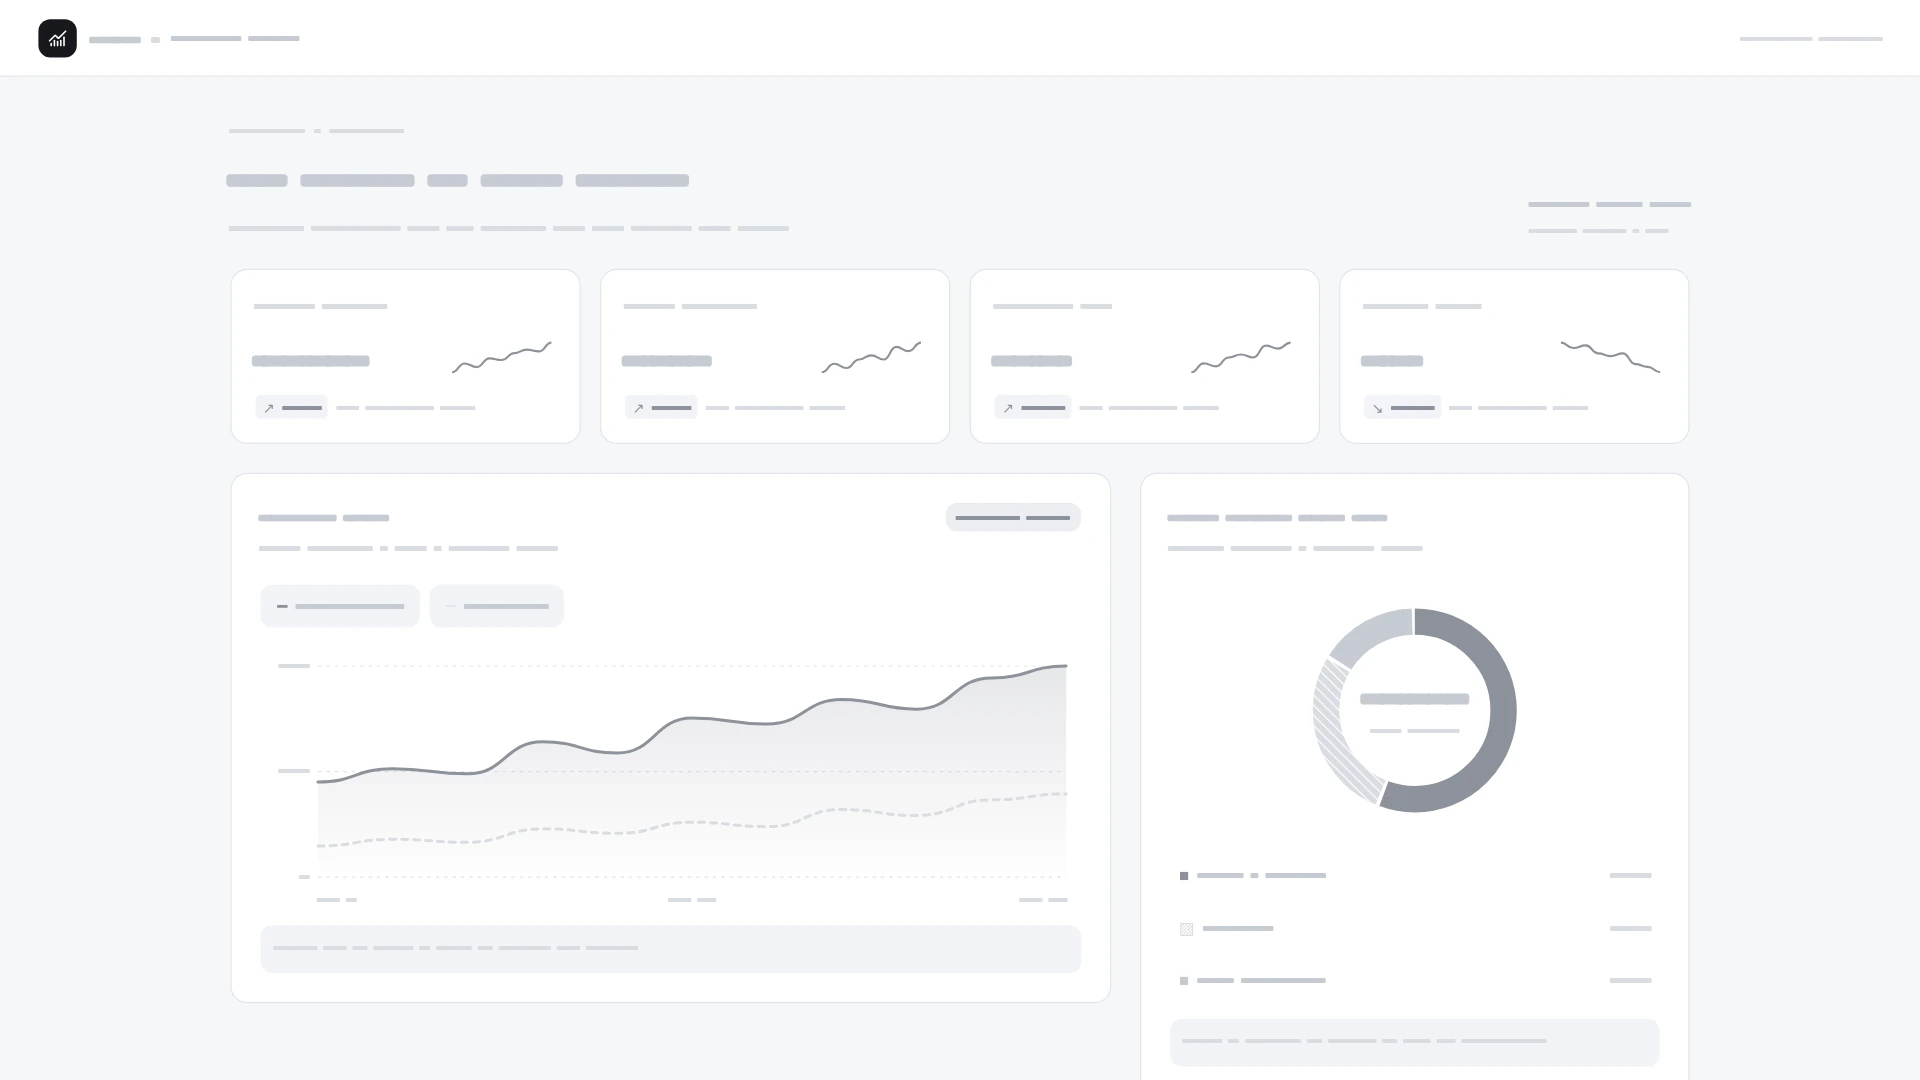
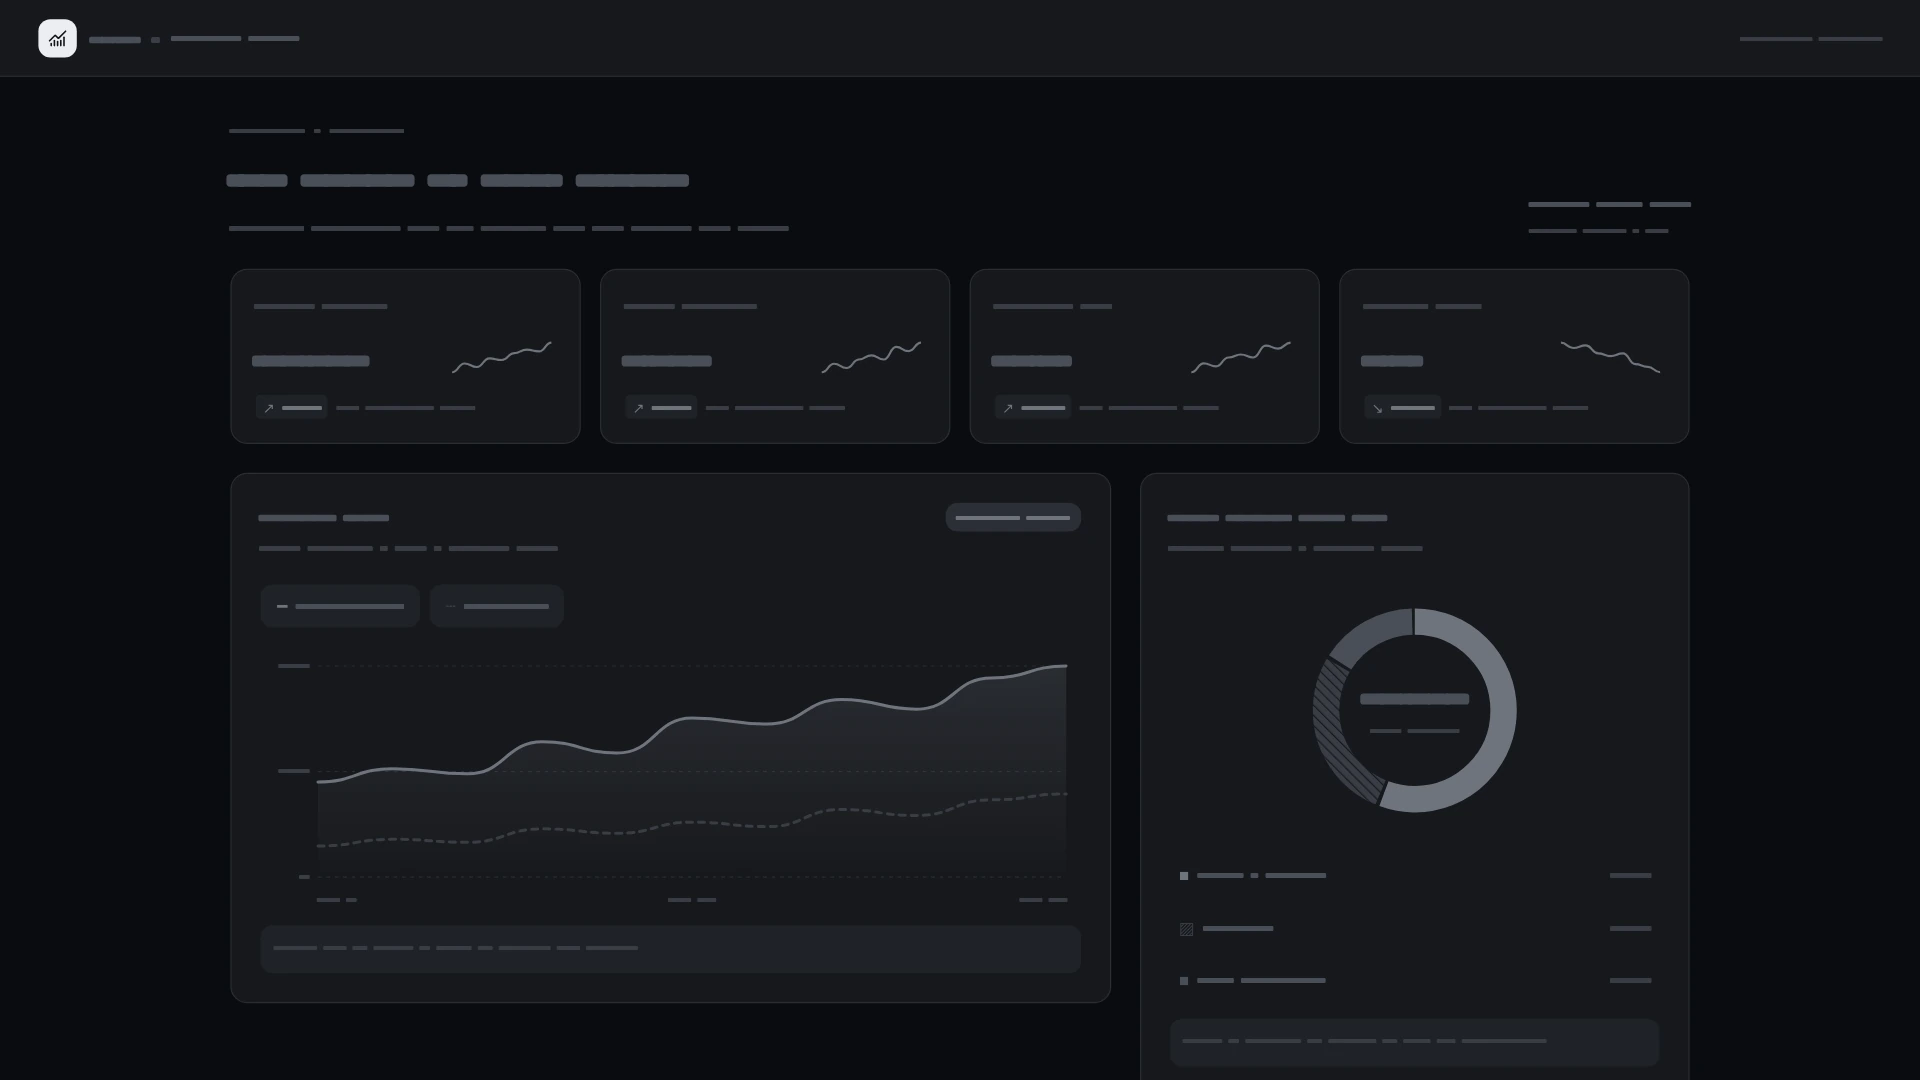
A complete product analytics workspace with seven accessible SVG data views. Every piece is wired into one full screen you can run, and each one also works on its own. Pieces (7): area chart, bar chart, donut chart, funnel chart, heatmap, kpi cards and period compare. Keyboard and screen readers: every piece works with the keyboard, and its guide lists its screen reader and reduced-motion behavior. Built with React 19 and TypeScript, Tailwind CSS 4 and Motion. Light and dark themes come from CSS variables you can edit, and every demo uses believable sample data you replace with your own. Included: the source of all 7 components, the composed charts & analytics screen, sample data, light and dark theme variables, a runnable demo app, and setup guides for people and for AI coding agents.
Highlights
- Production-ready, documented source
- Clean, componentized architecture
- Drops into your stack with minimal setup