Overview
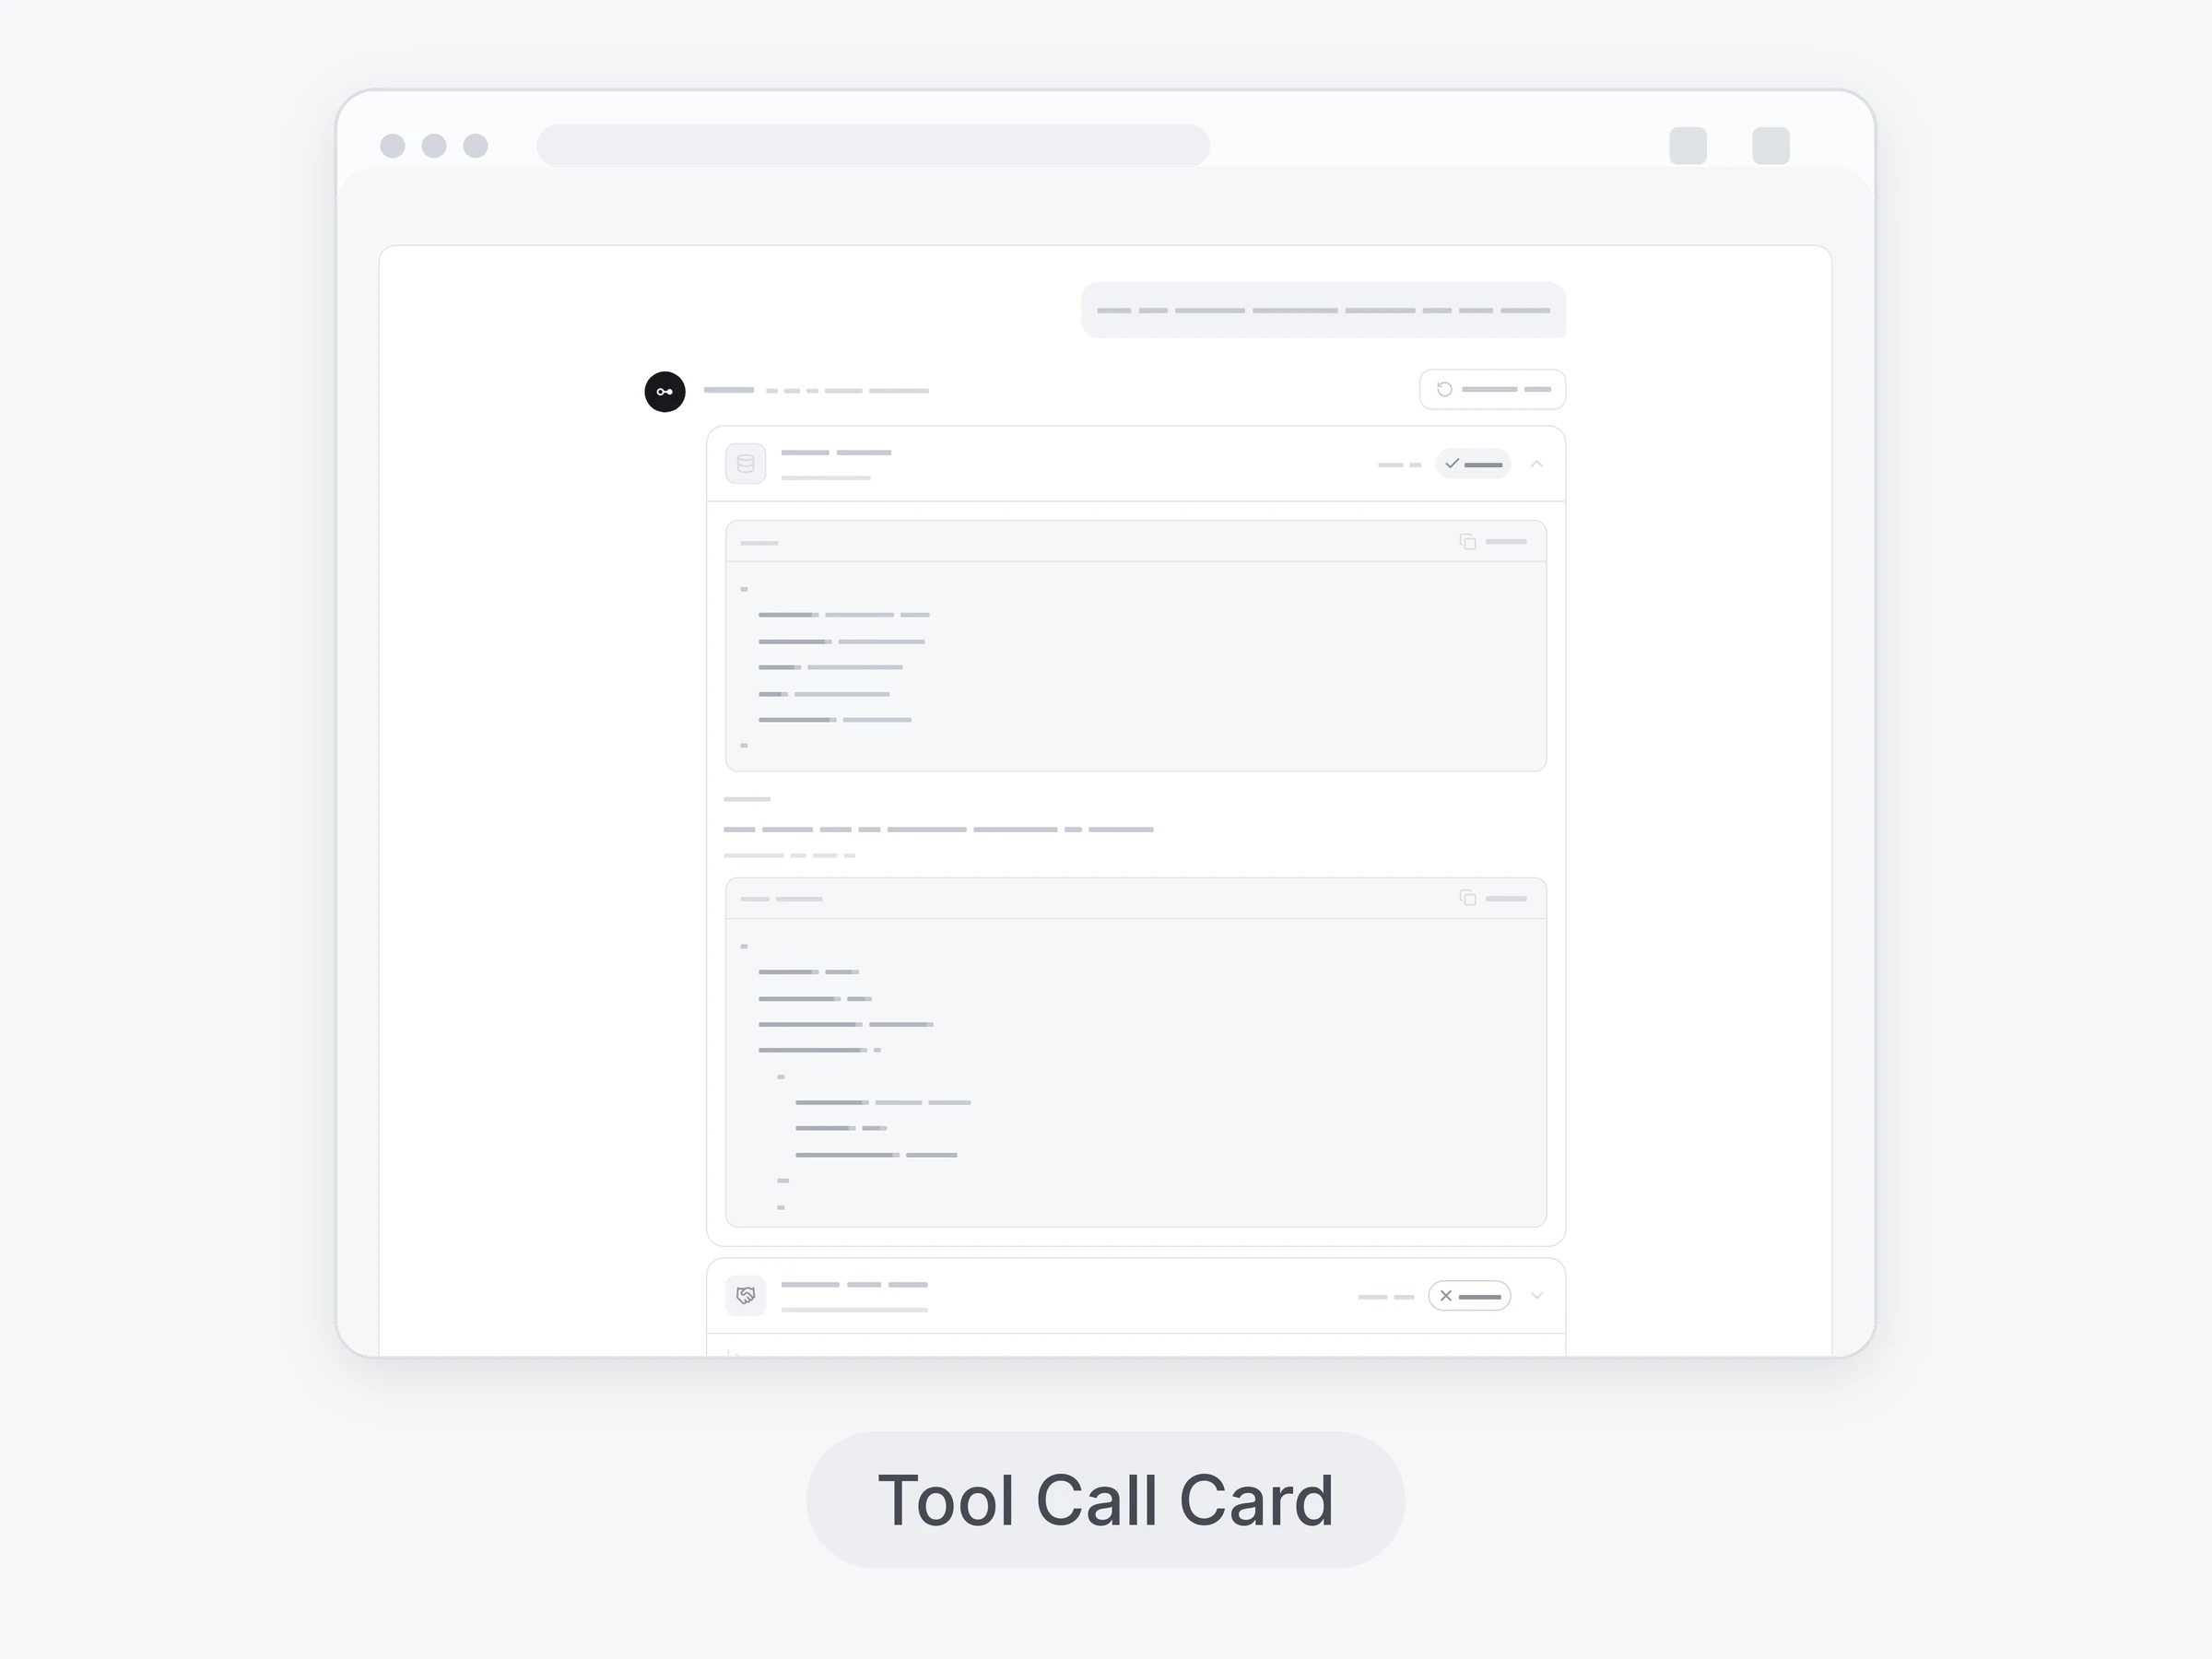
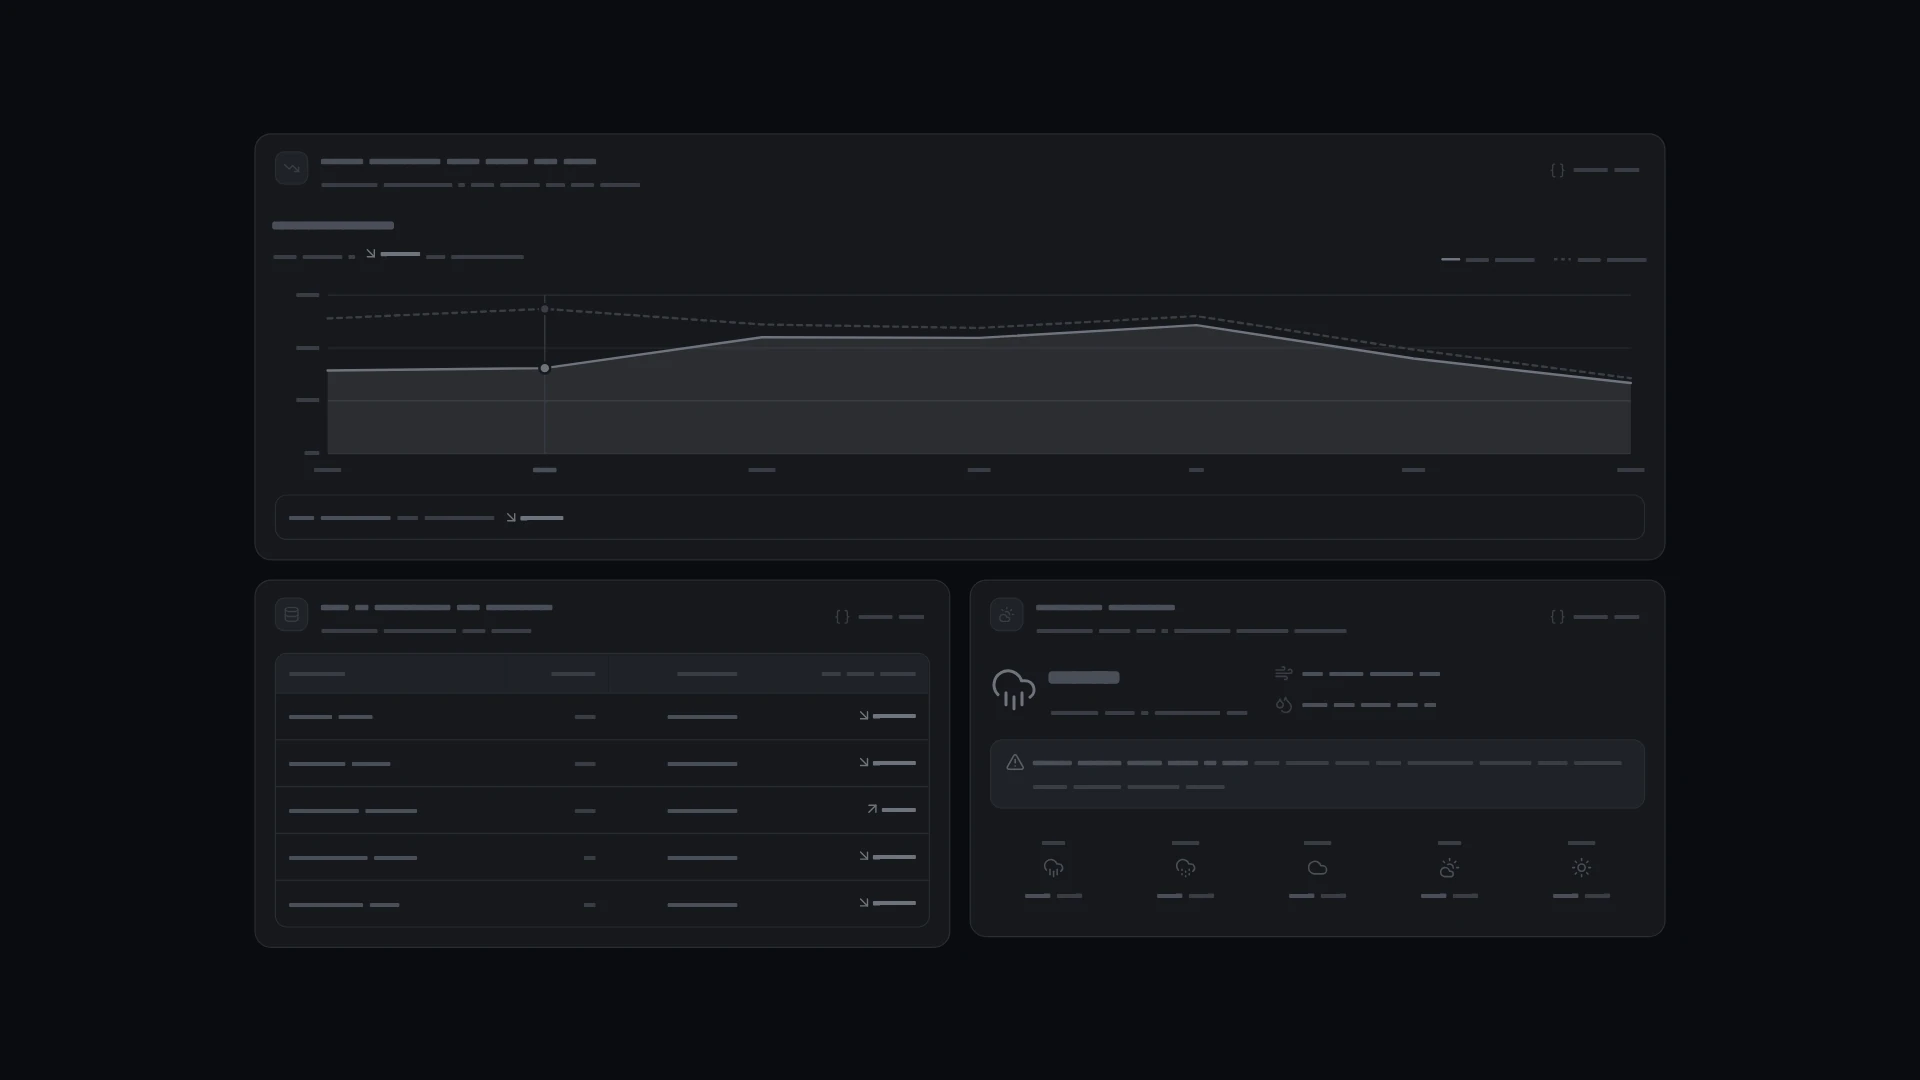
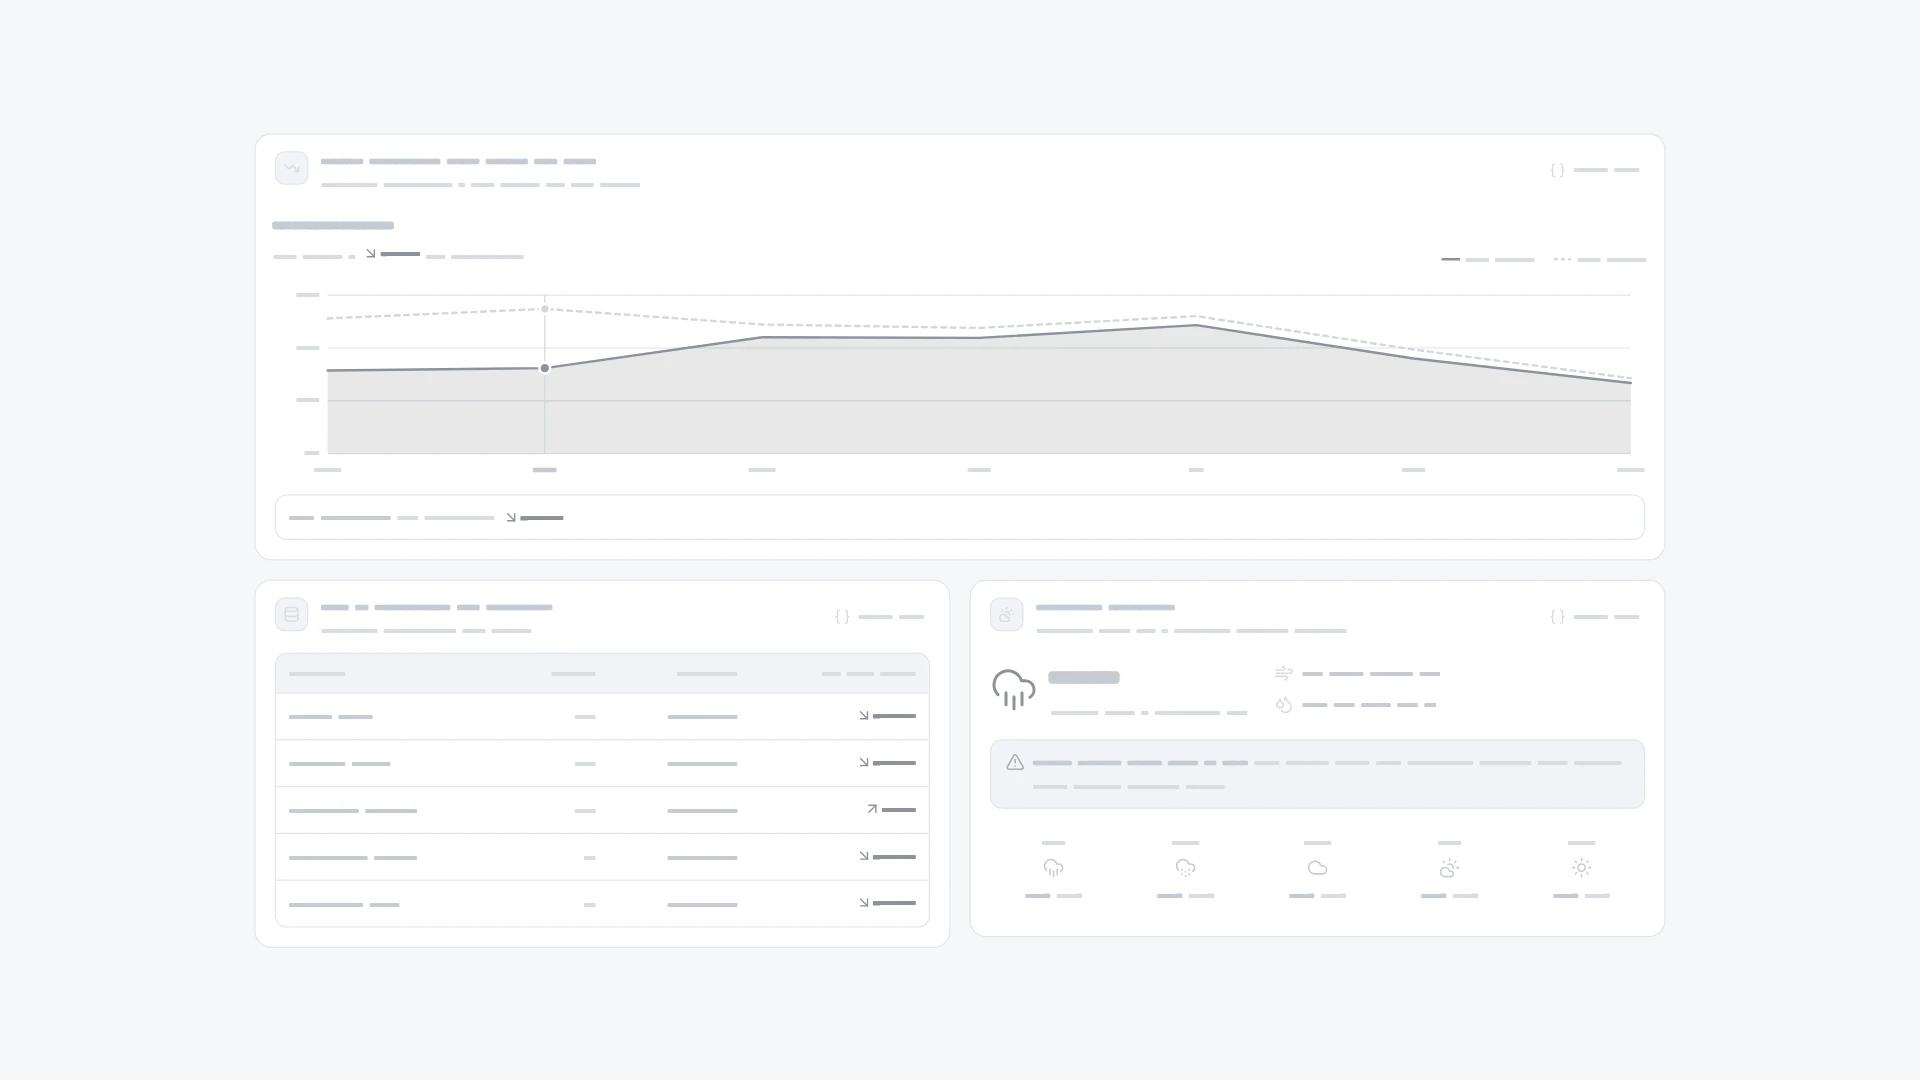
A tool's output shown as a readable card: a 5-row data table, a two-week line chart or a weather report, each with a View raw toggle. It comes from the Tool calls kit and also works on its own. Keyboard and screen readers: The table has a caption, column headers and row headers; changes carry an arrow and a sign, not only color. The chart takes focus: left and right arrows, Home and End move between days, and the readout under it is announced. The chart is a plain SVG with a legend and dashed versus solid lines; nothing in it animates. Built with React 19 and TypeScript, Tailwind CSS 4 and Lucide icons. Light and dark themes come from CSS variables you can edit, and every demo uses believable sample data you replace with your own. Included: the component source, its sample data, light and dark theme variables, a runnable demo page, and setup guides for people and for AI coding agents.
Highlights
- Production-ready, documented source
- Clean, componentized architecture
- Drops into your stack with minimal setup