Kelpwell Dashboard: Dashboard Template for Figma | HorizonX

Premium UI/UX

Kelpwell Dashboard

New

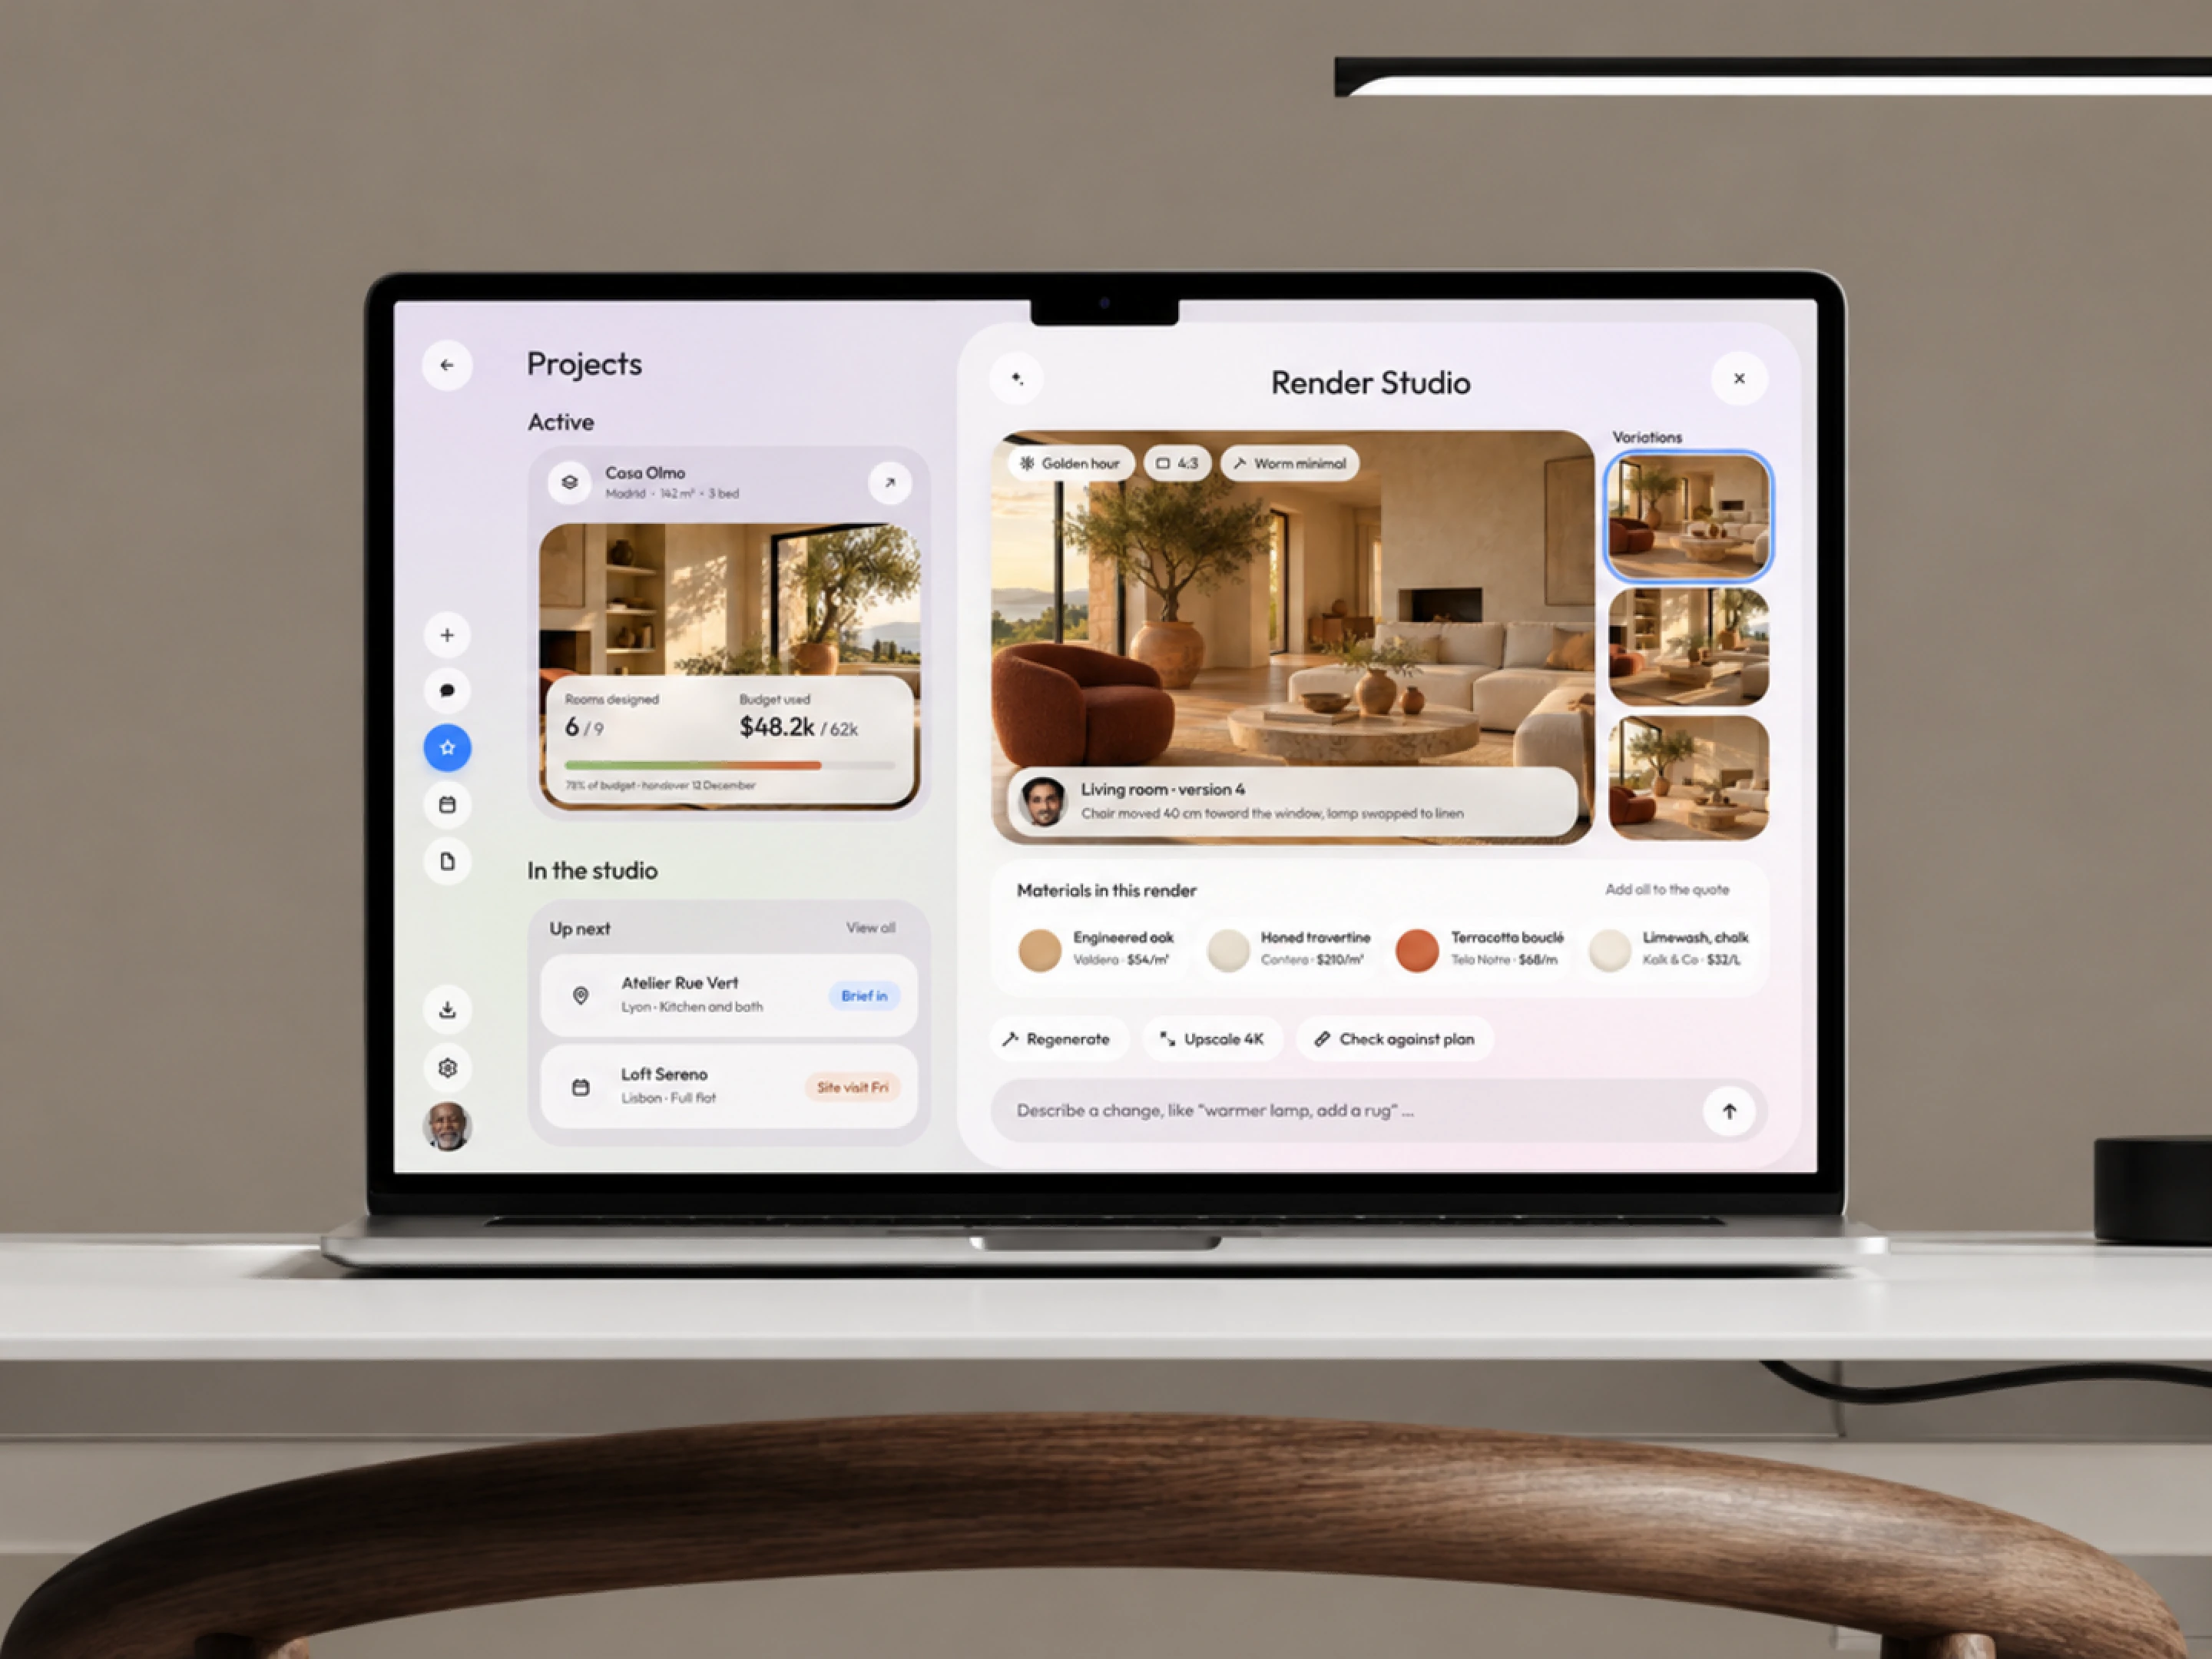
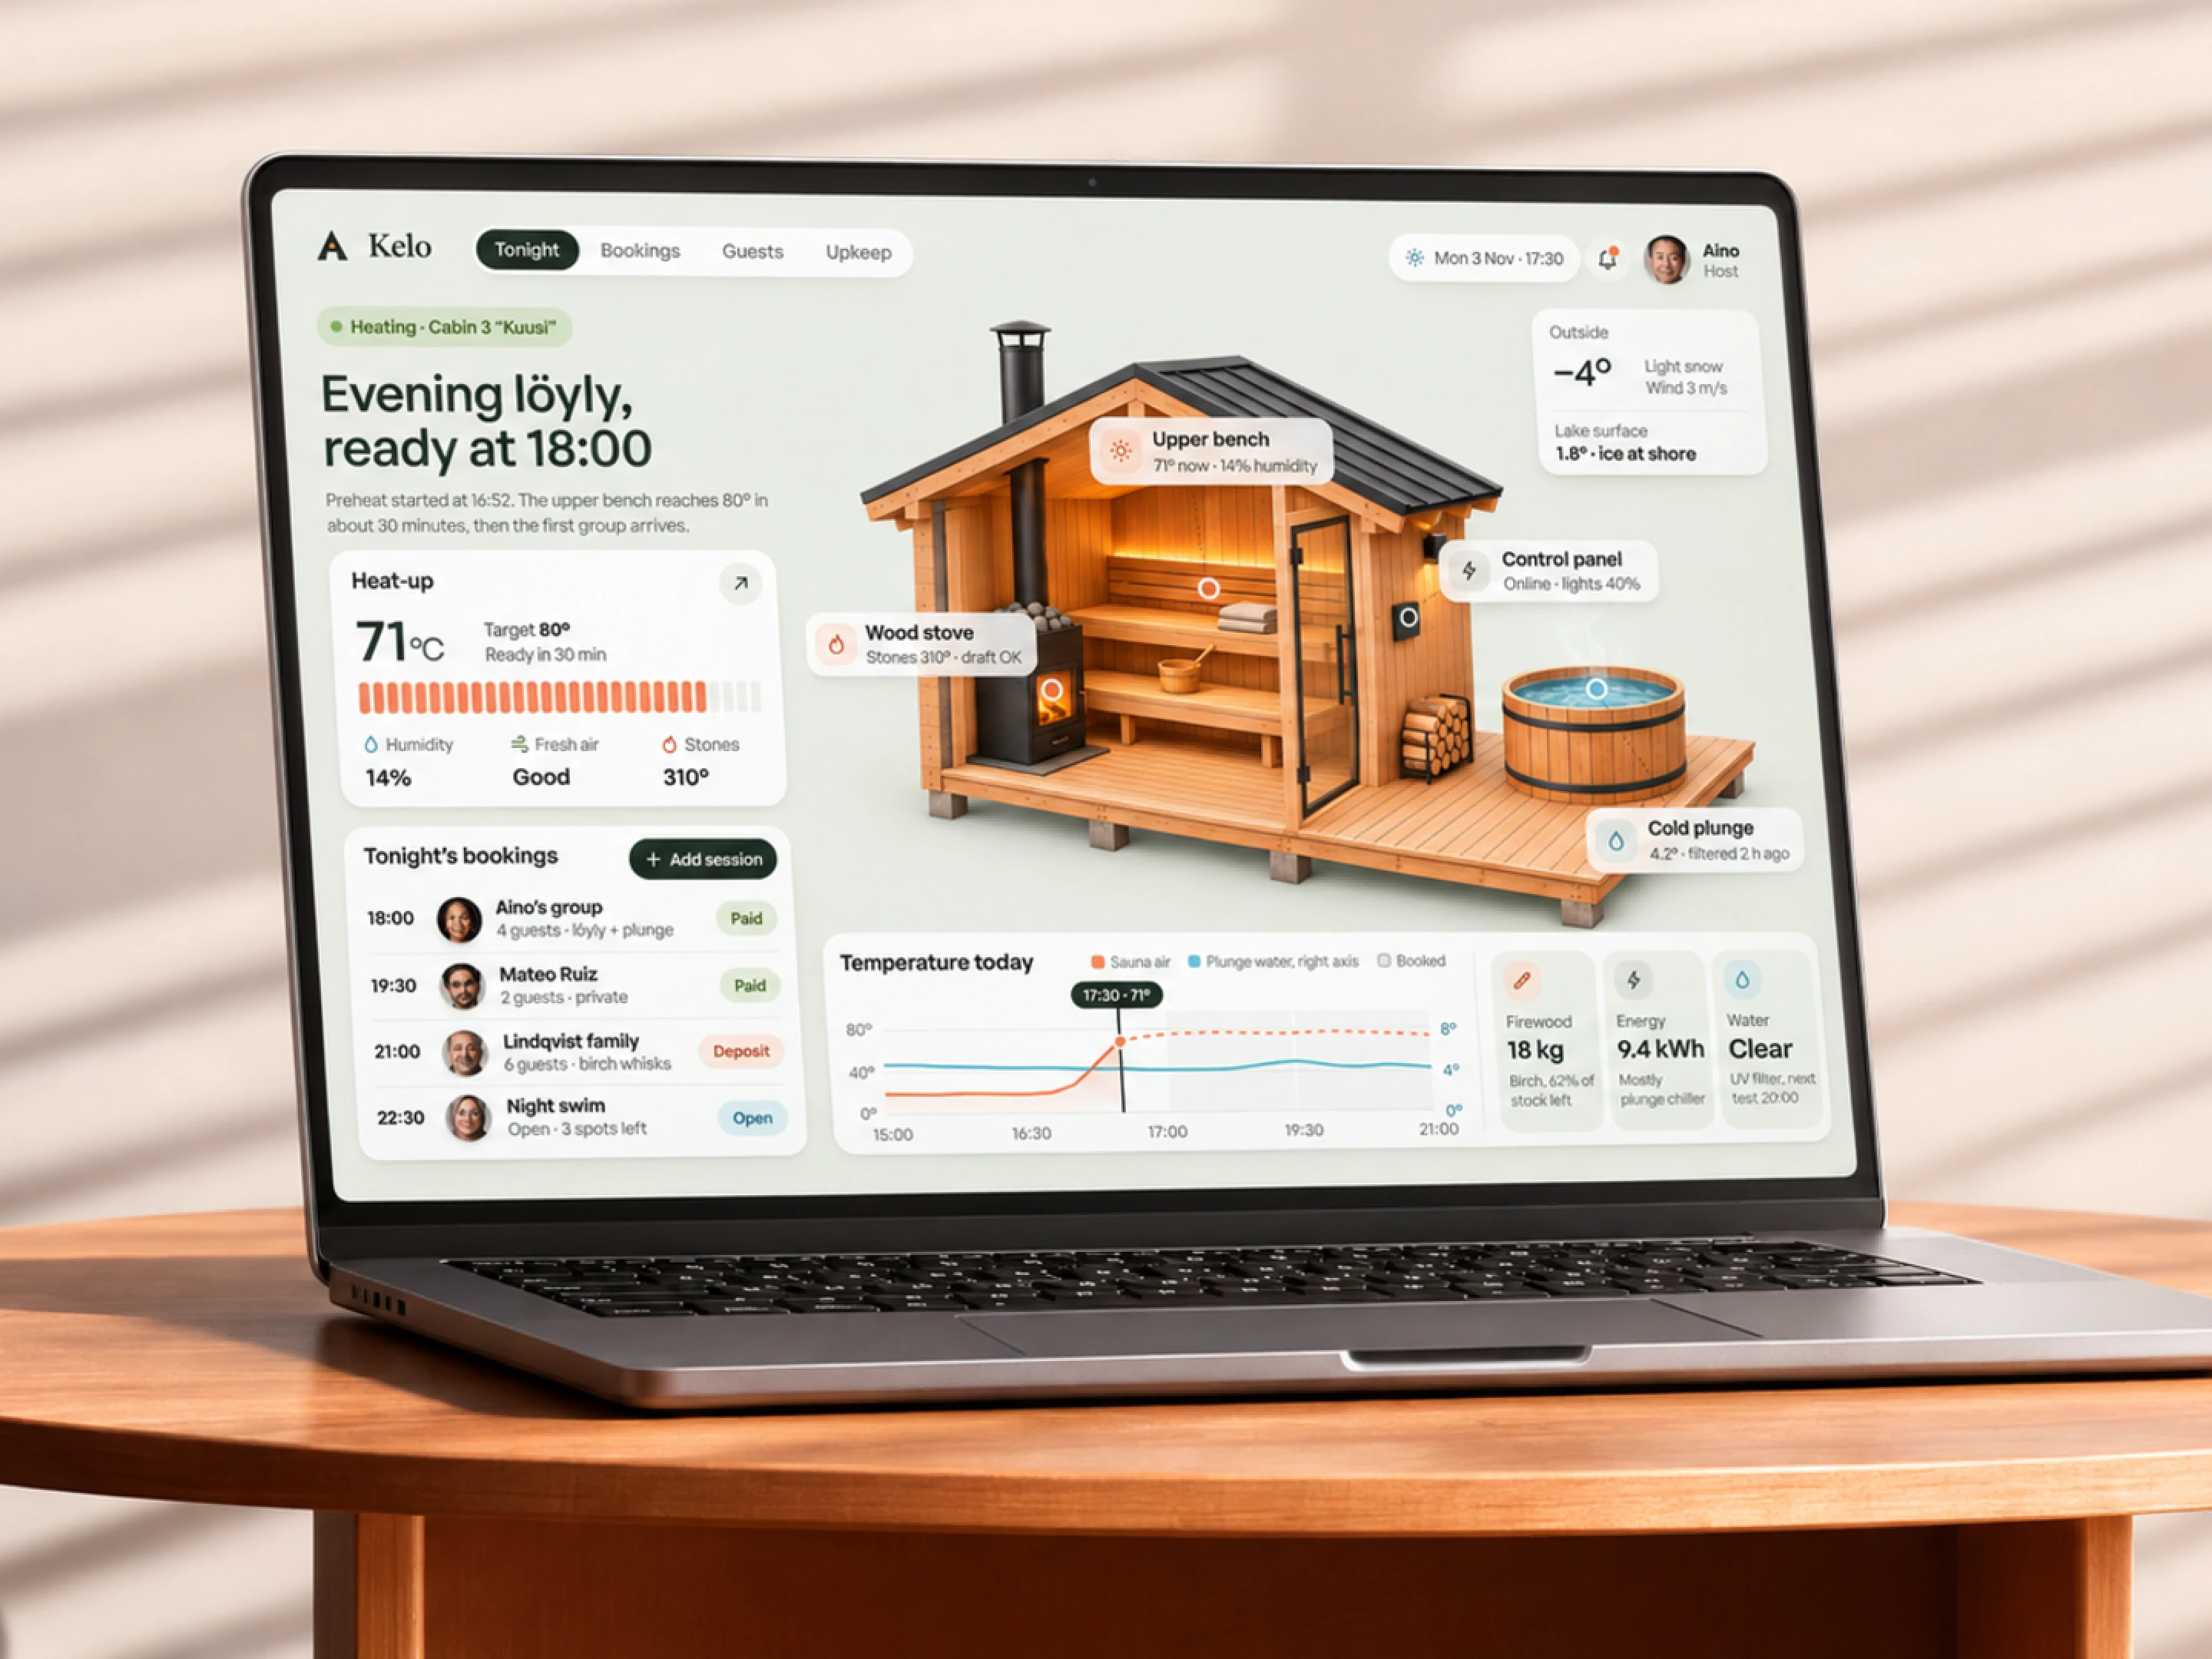
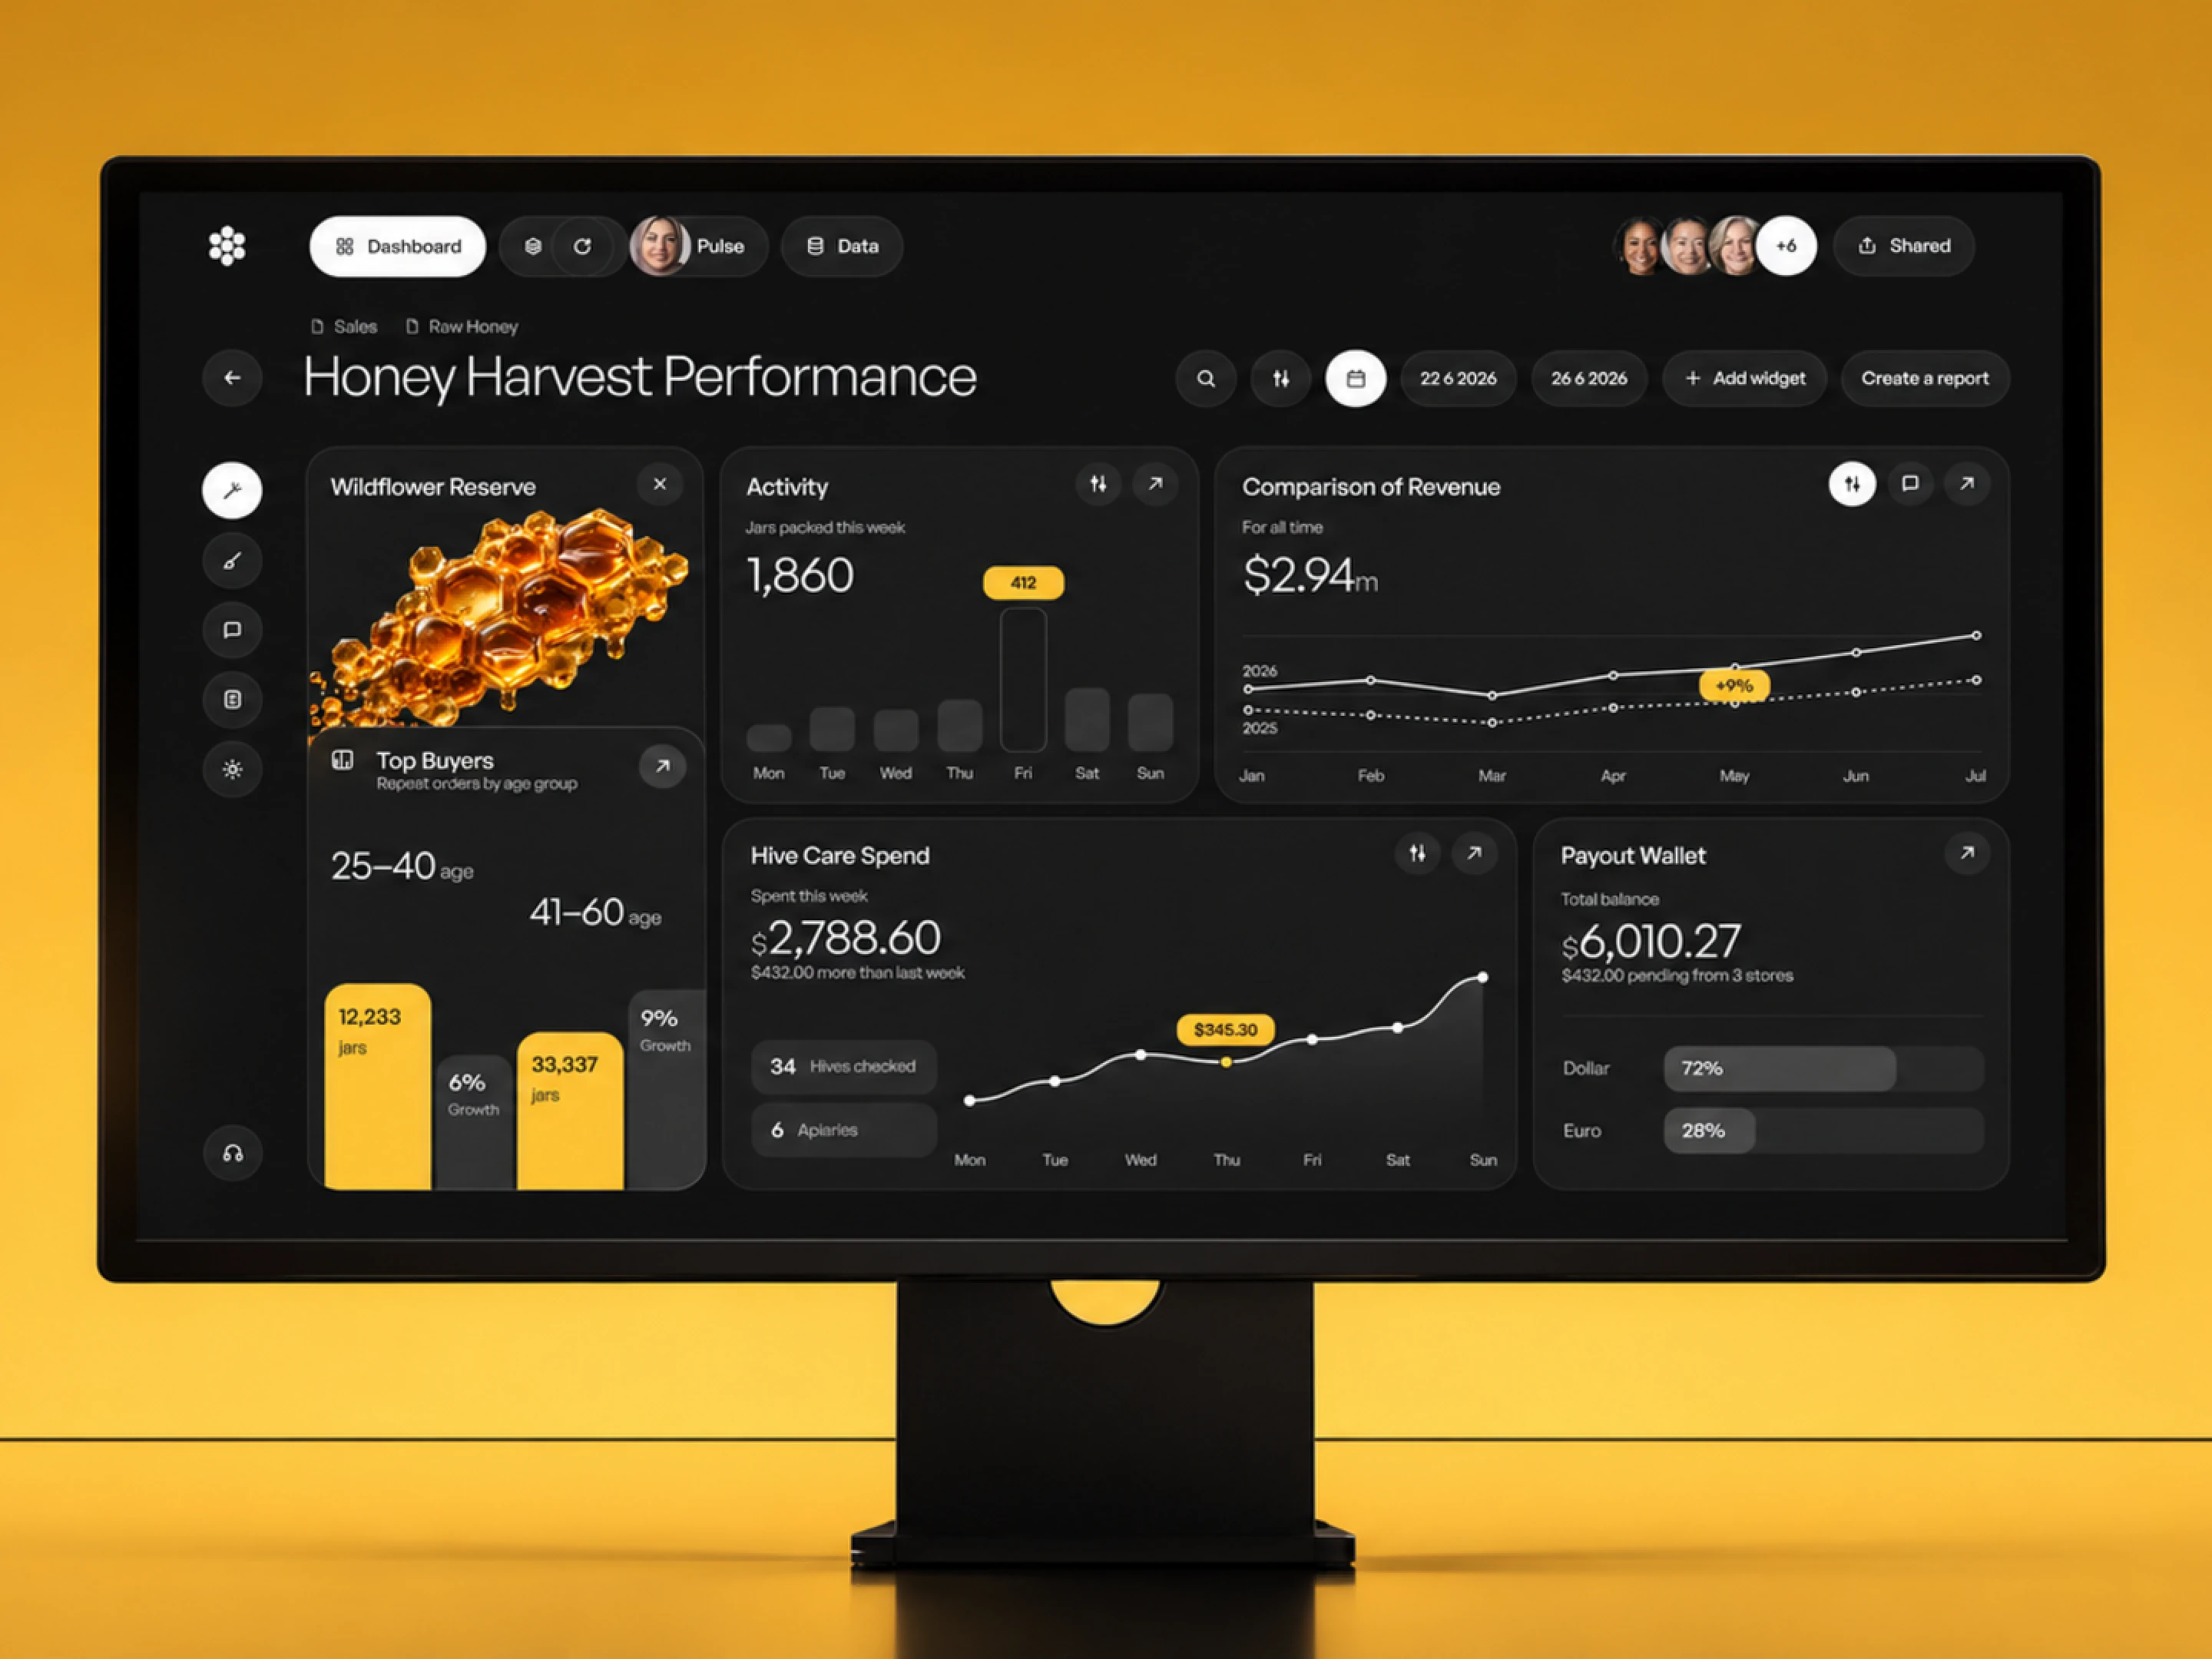
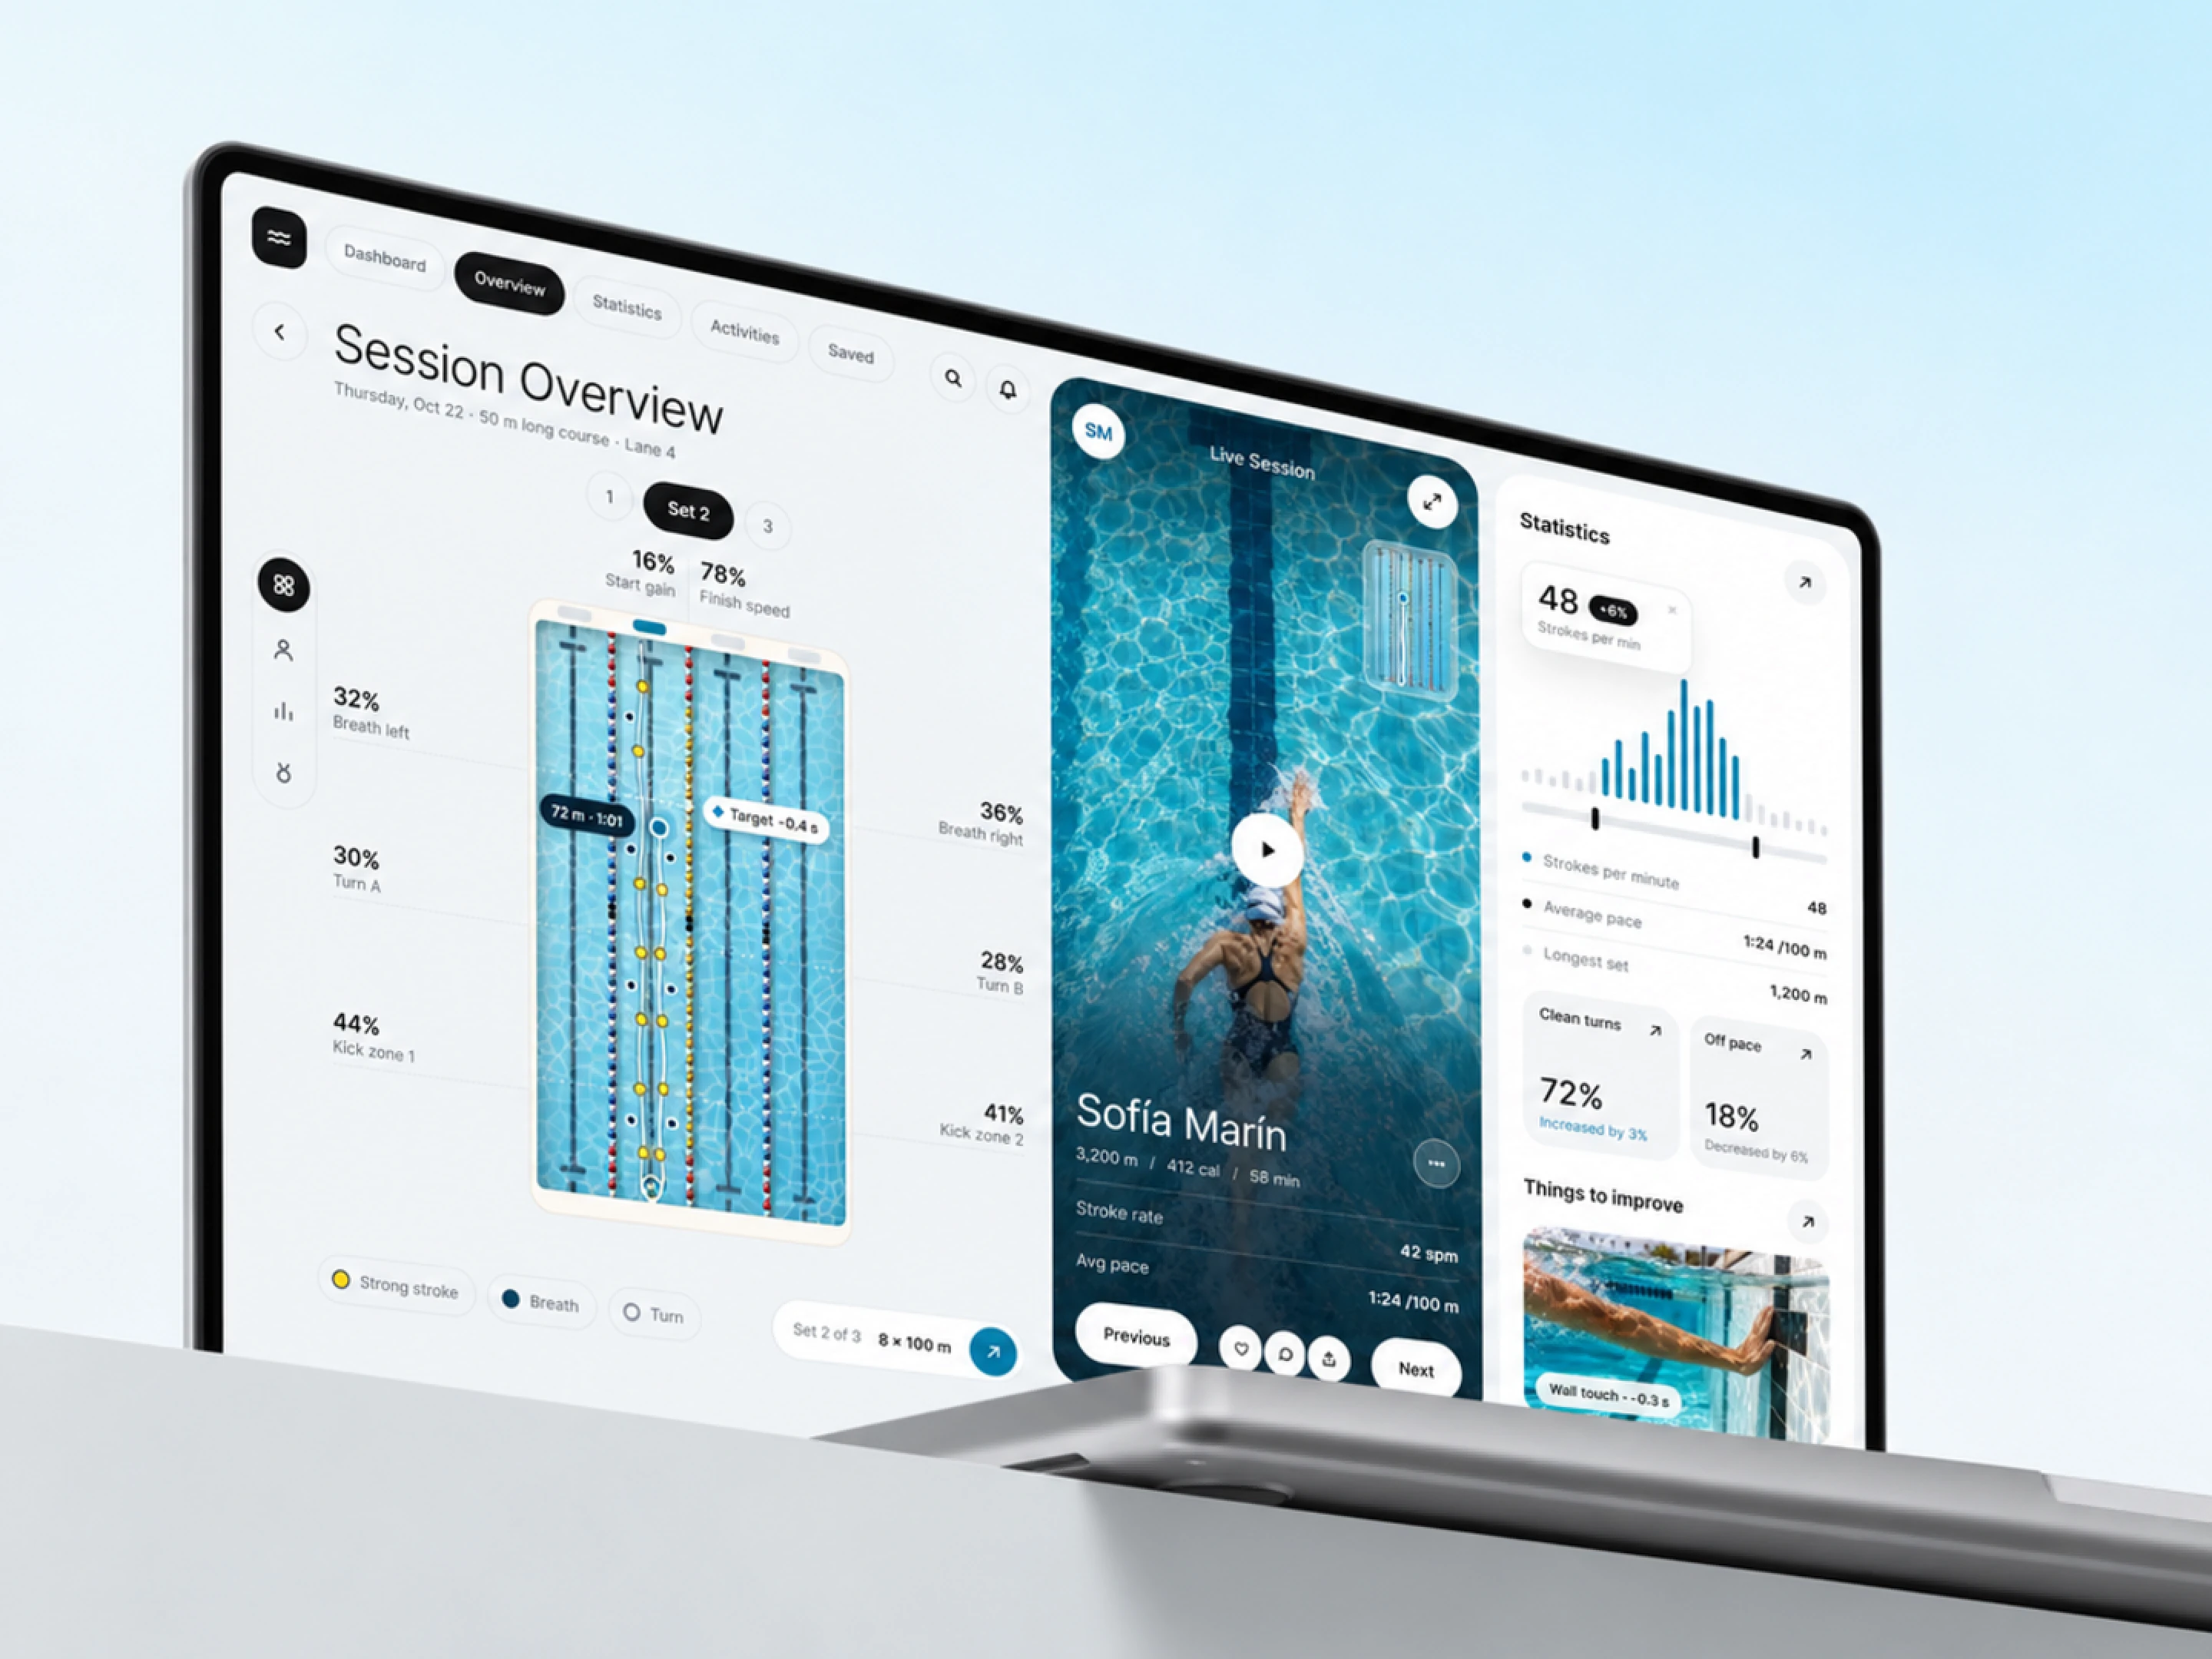
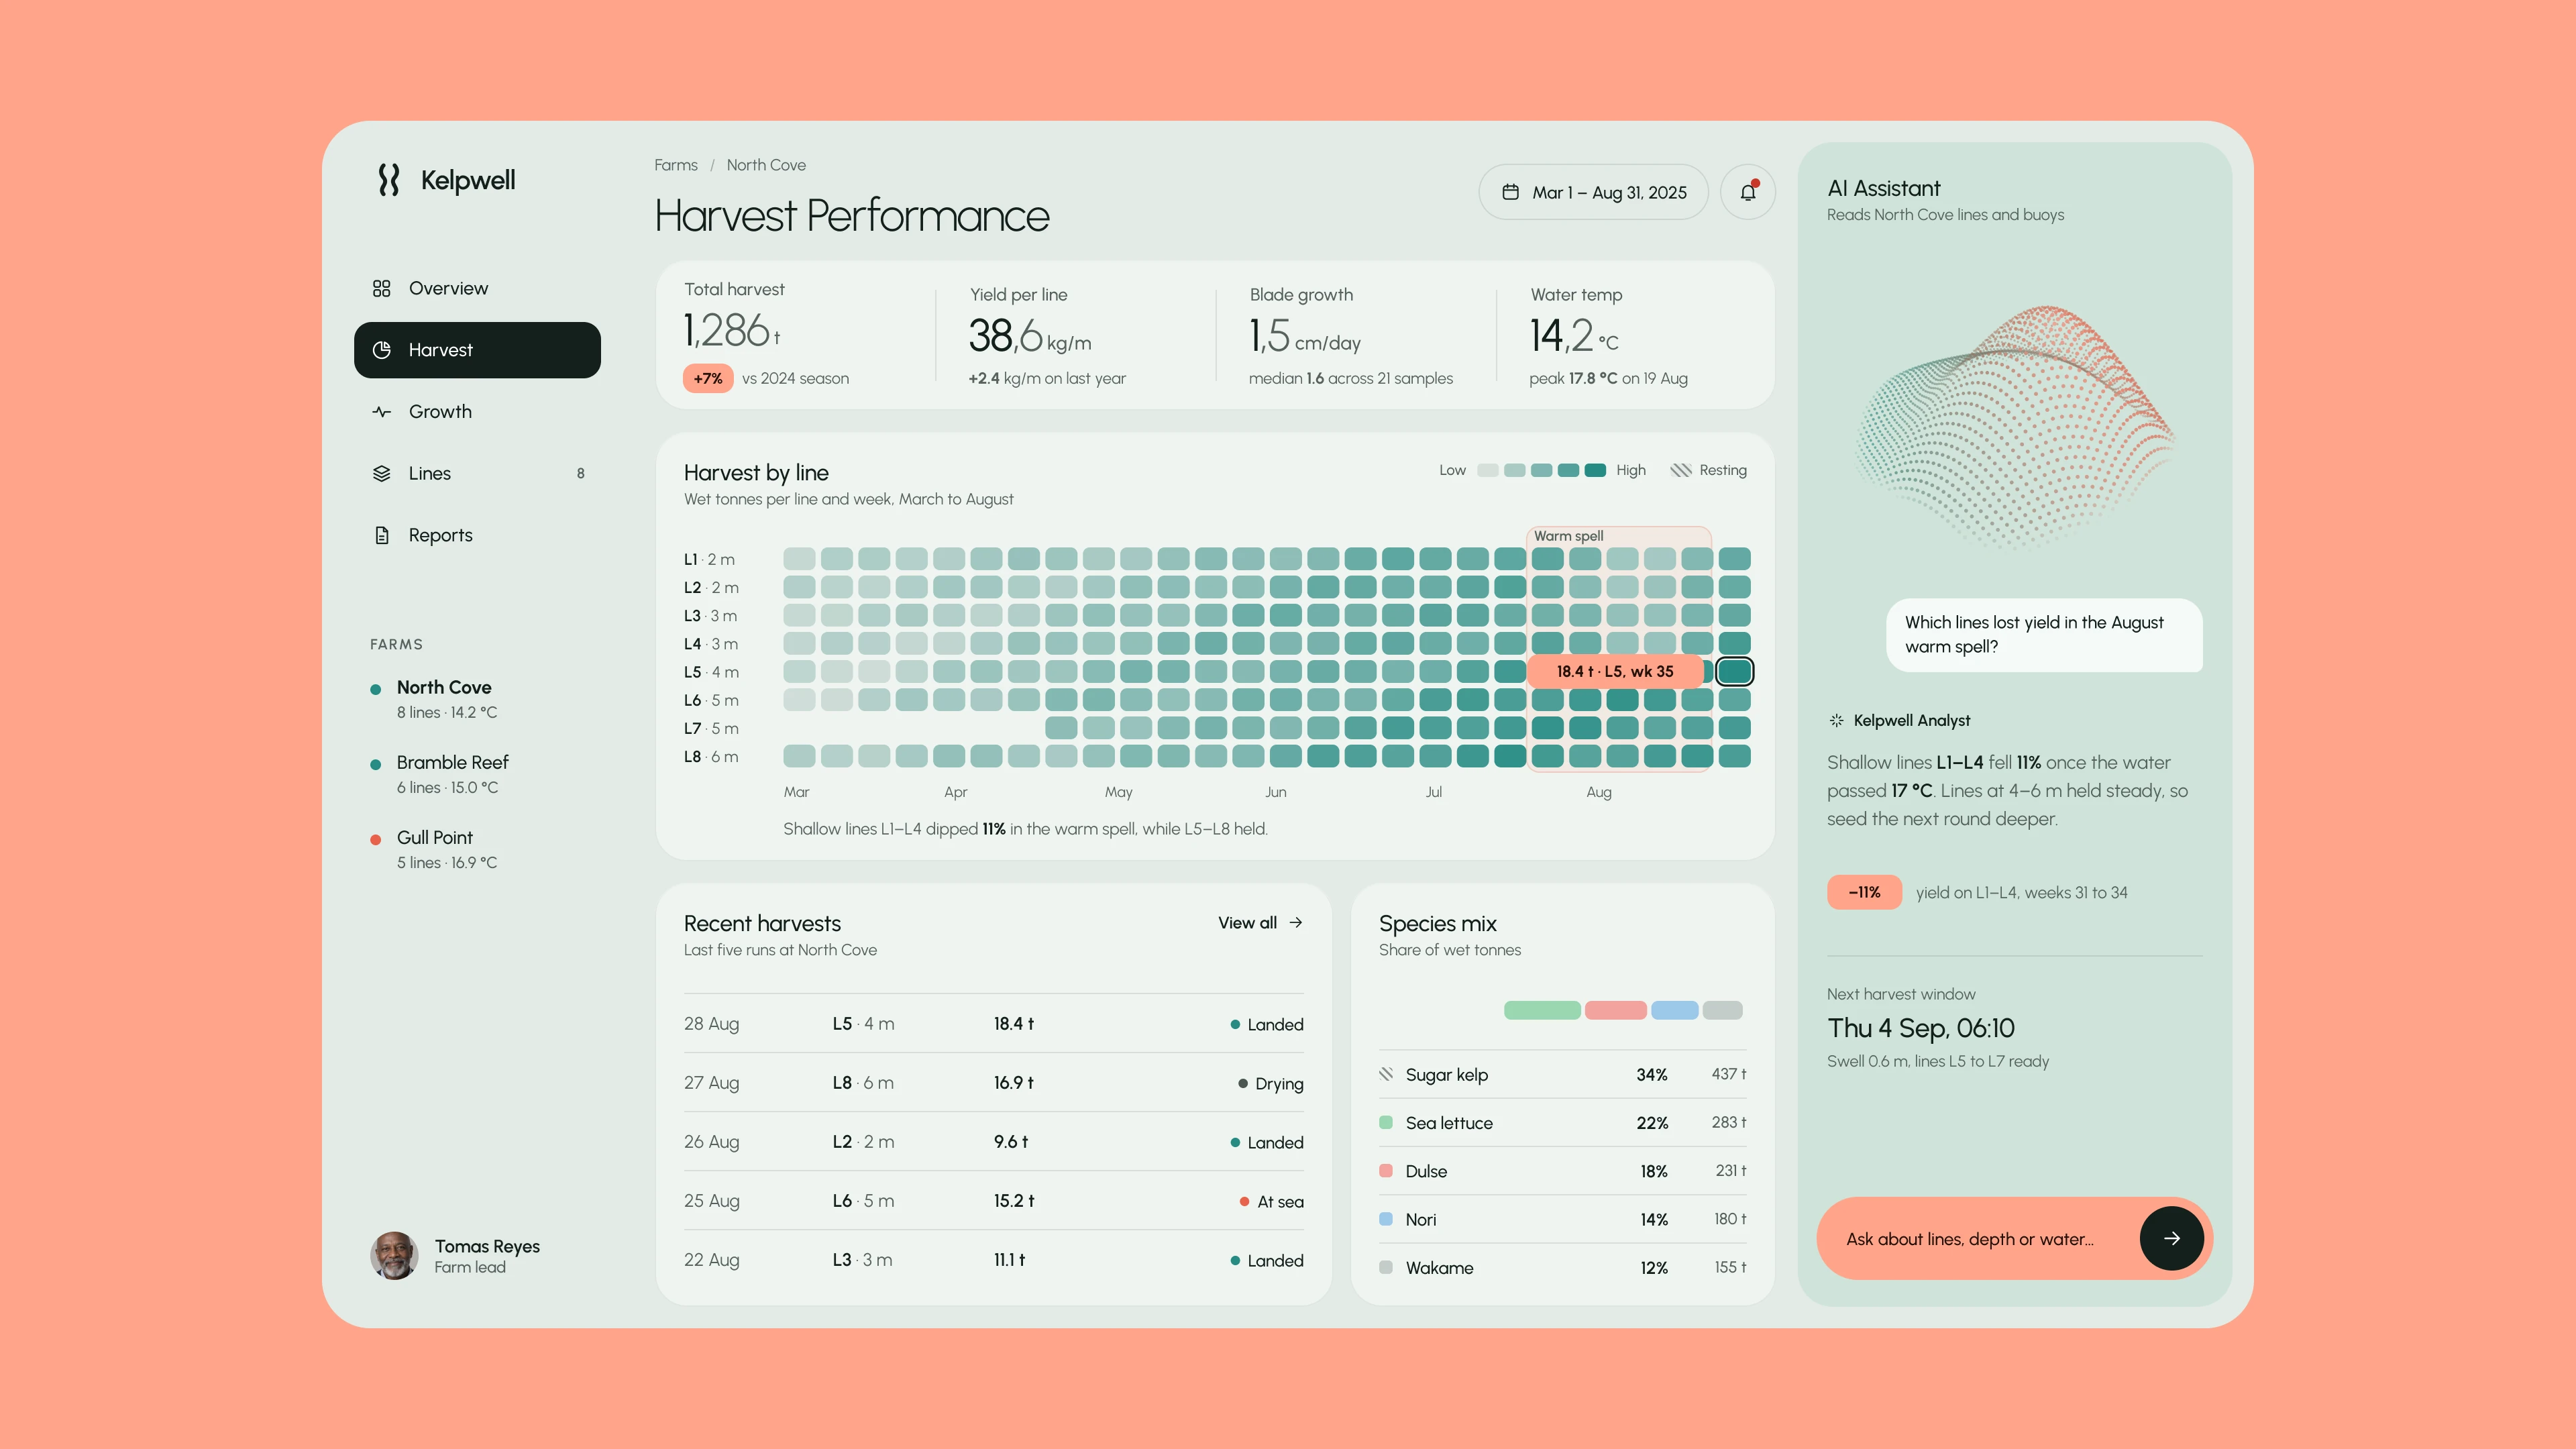
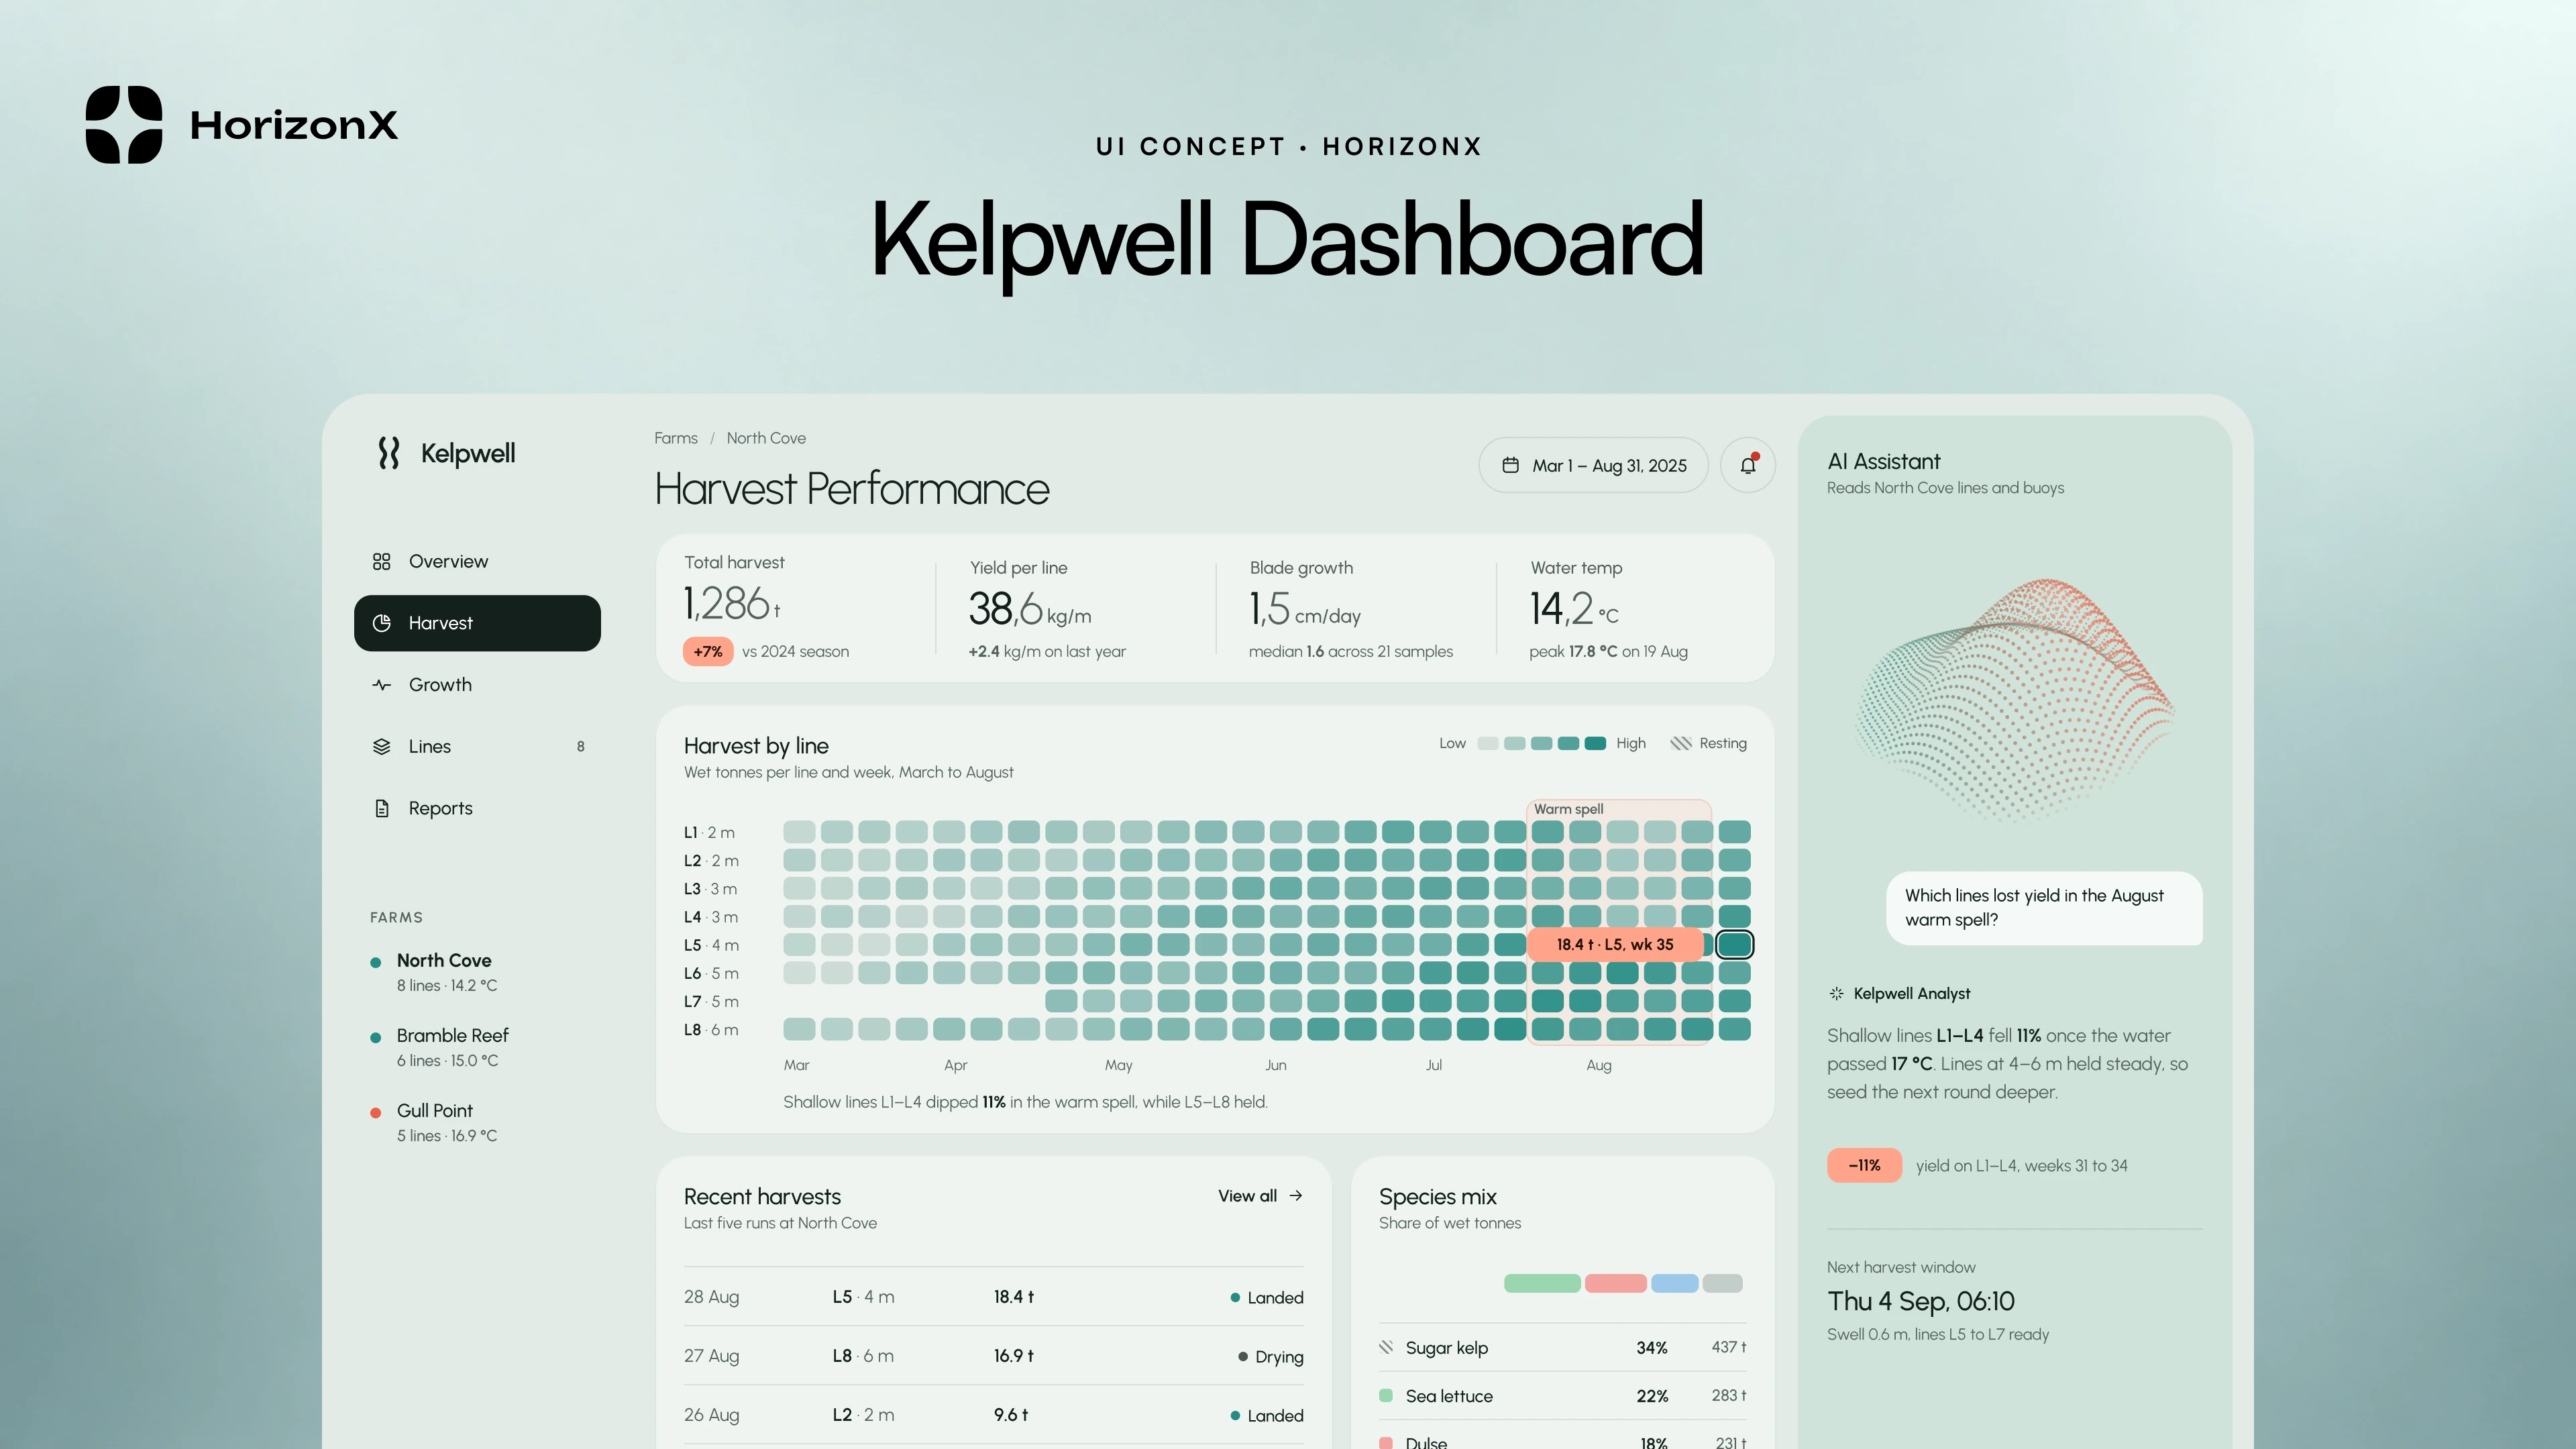
Light kelp farm harvest dashboard: yield KPIs, weekly harvest heatmap by line, AI notes and species mix

Kelpwell Dashboard, image 4
Kelpwell Dashboard, image 1
Kelpwell Dashboard, image 2
Kelpwell Dashboard, image 3
Kelpwell Dashboard, image 4
Kelpwell Dashboard, image 1
  • Instant access Included with every membership
  • Editable Figma source Copy straight to your workspace
  • Commercial license With a membership, for client work

Overview

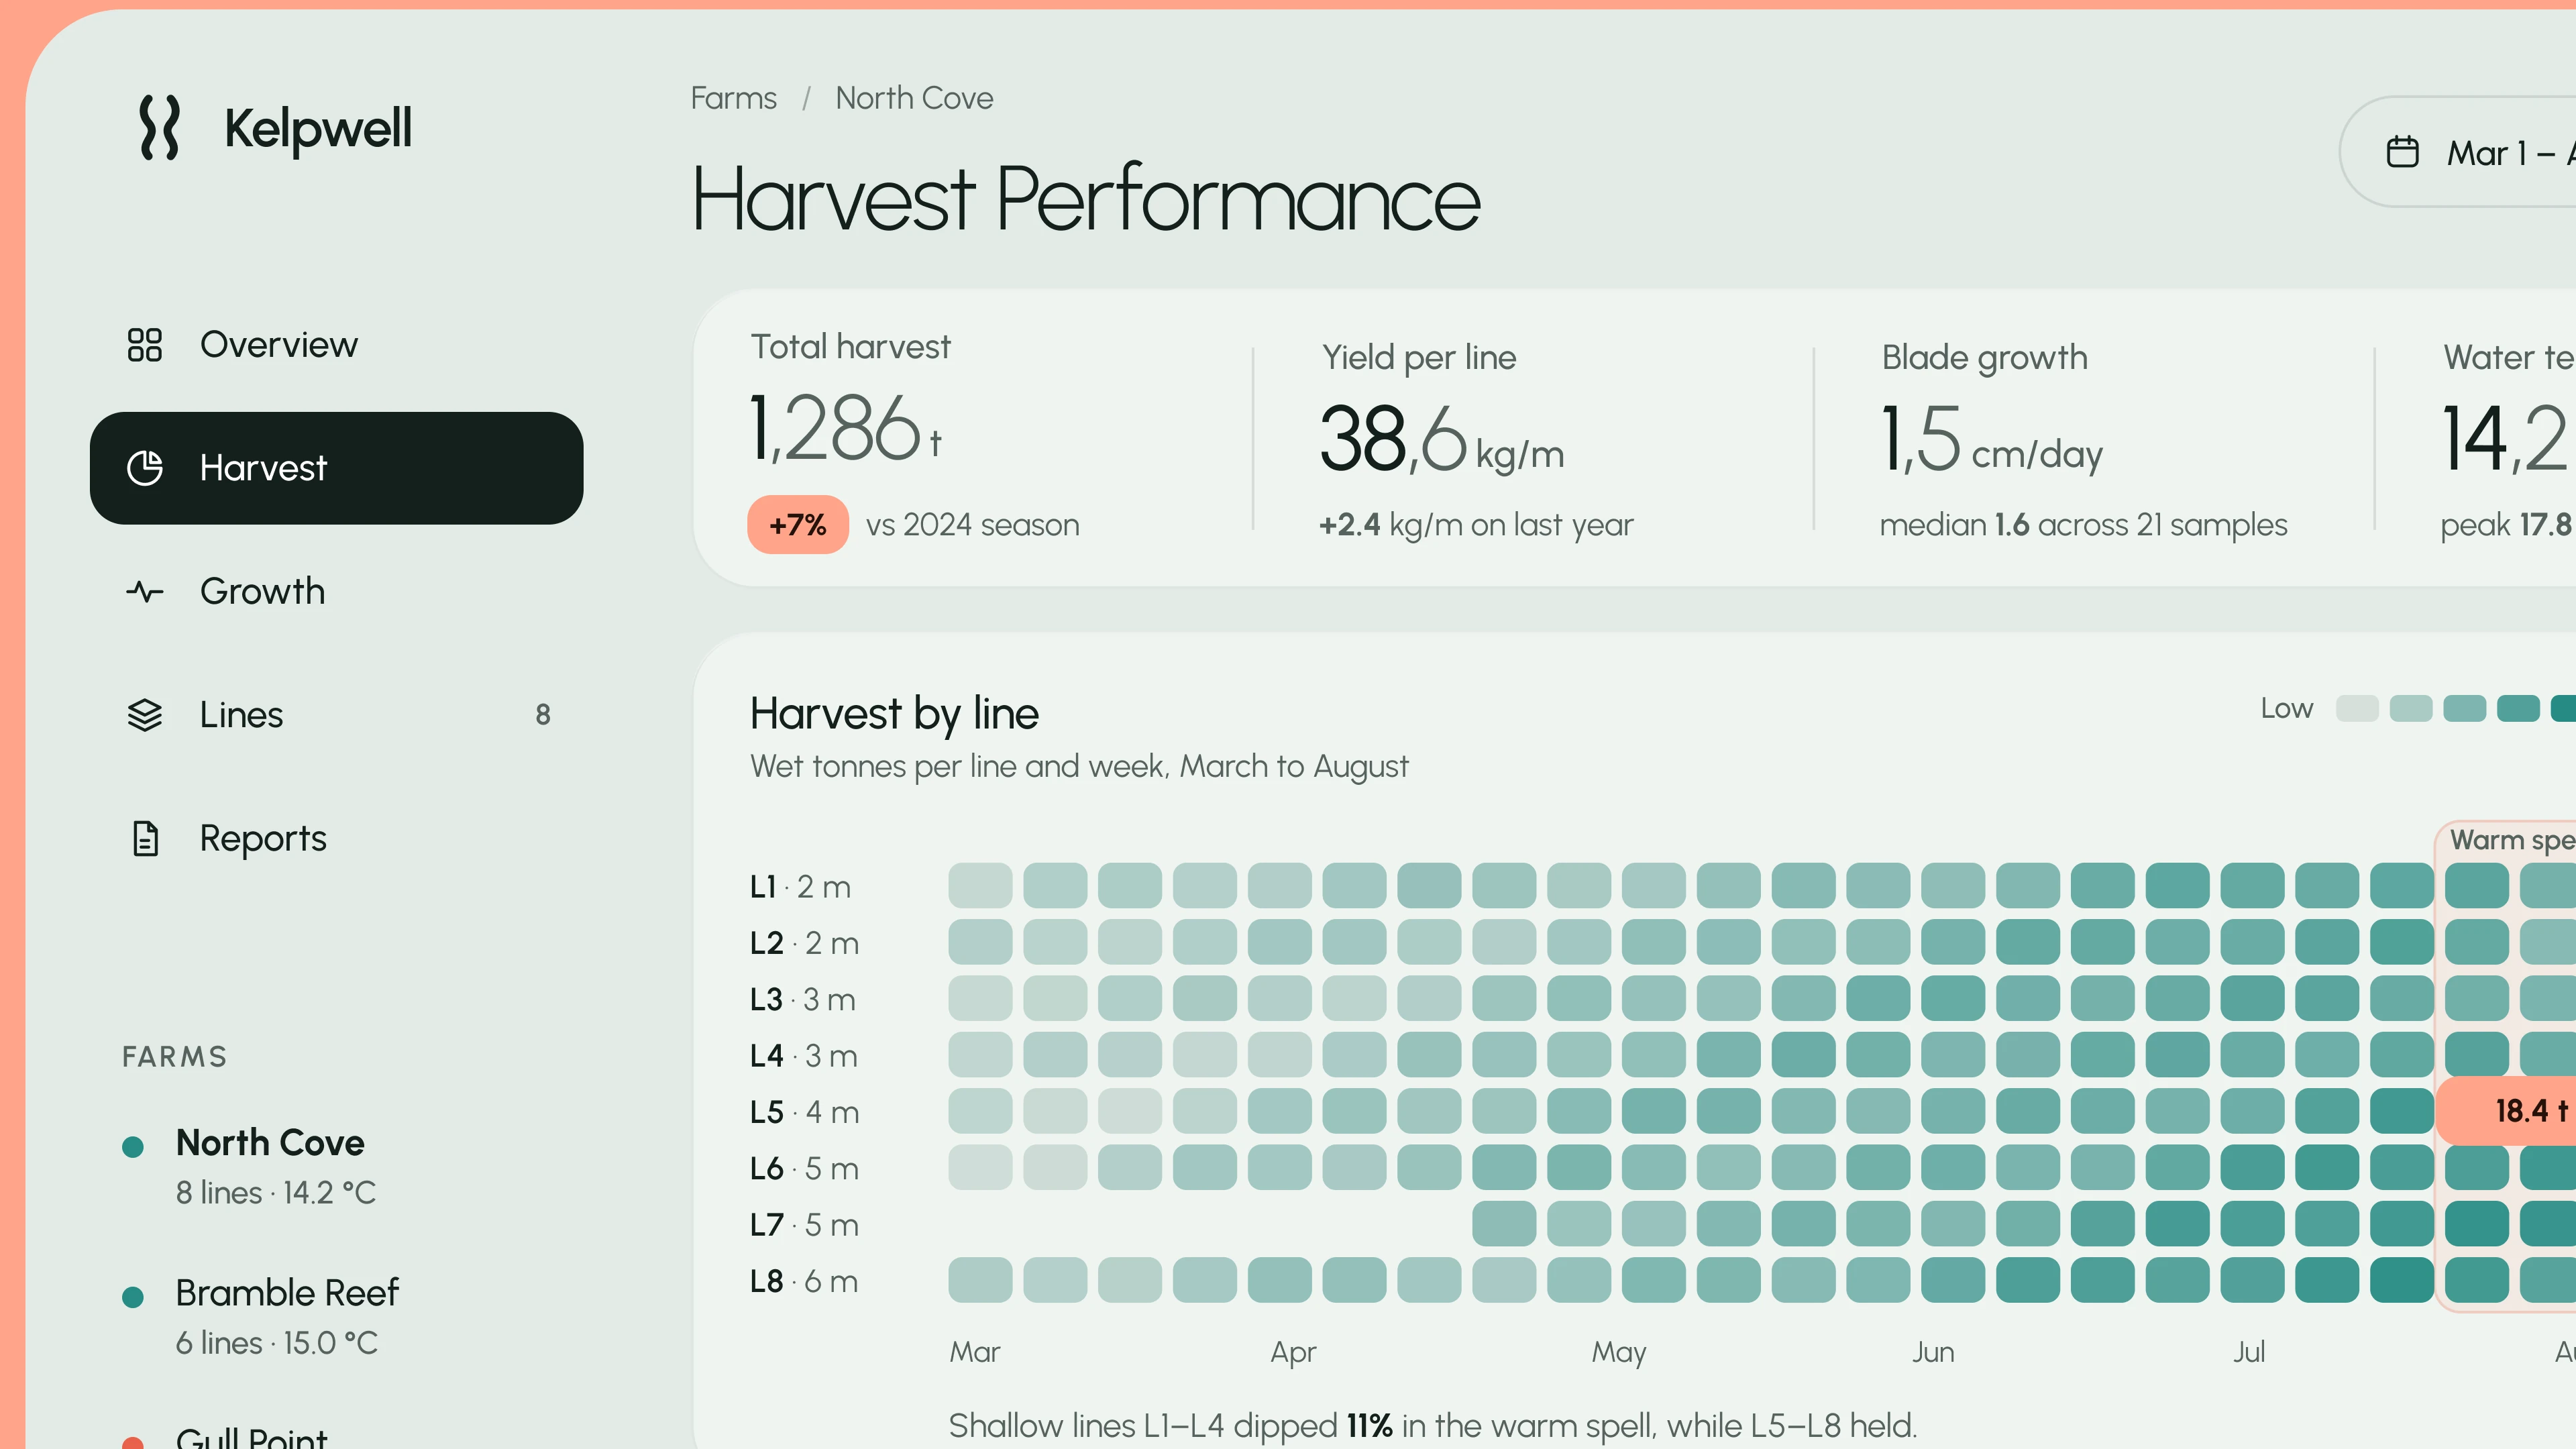
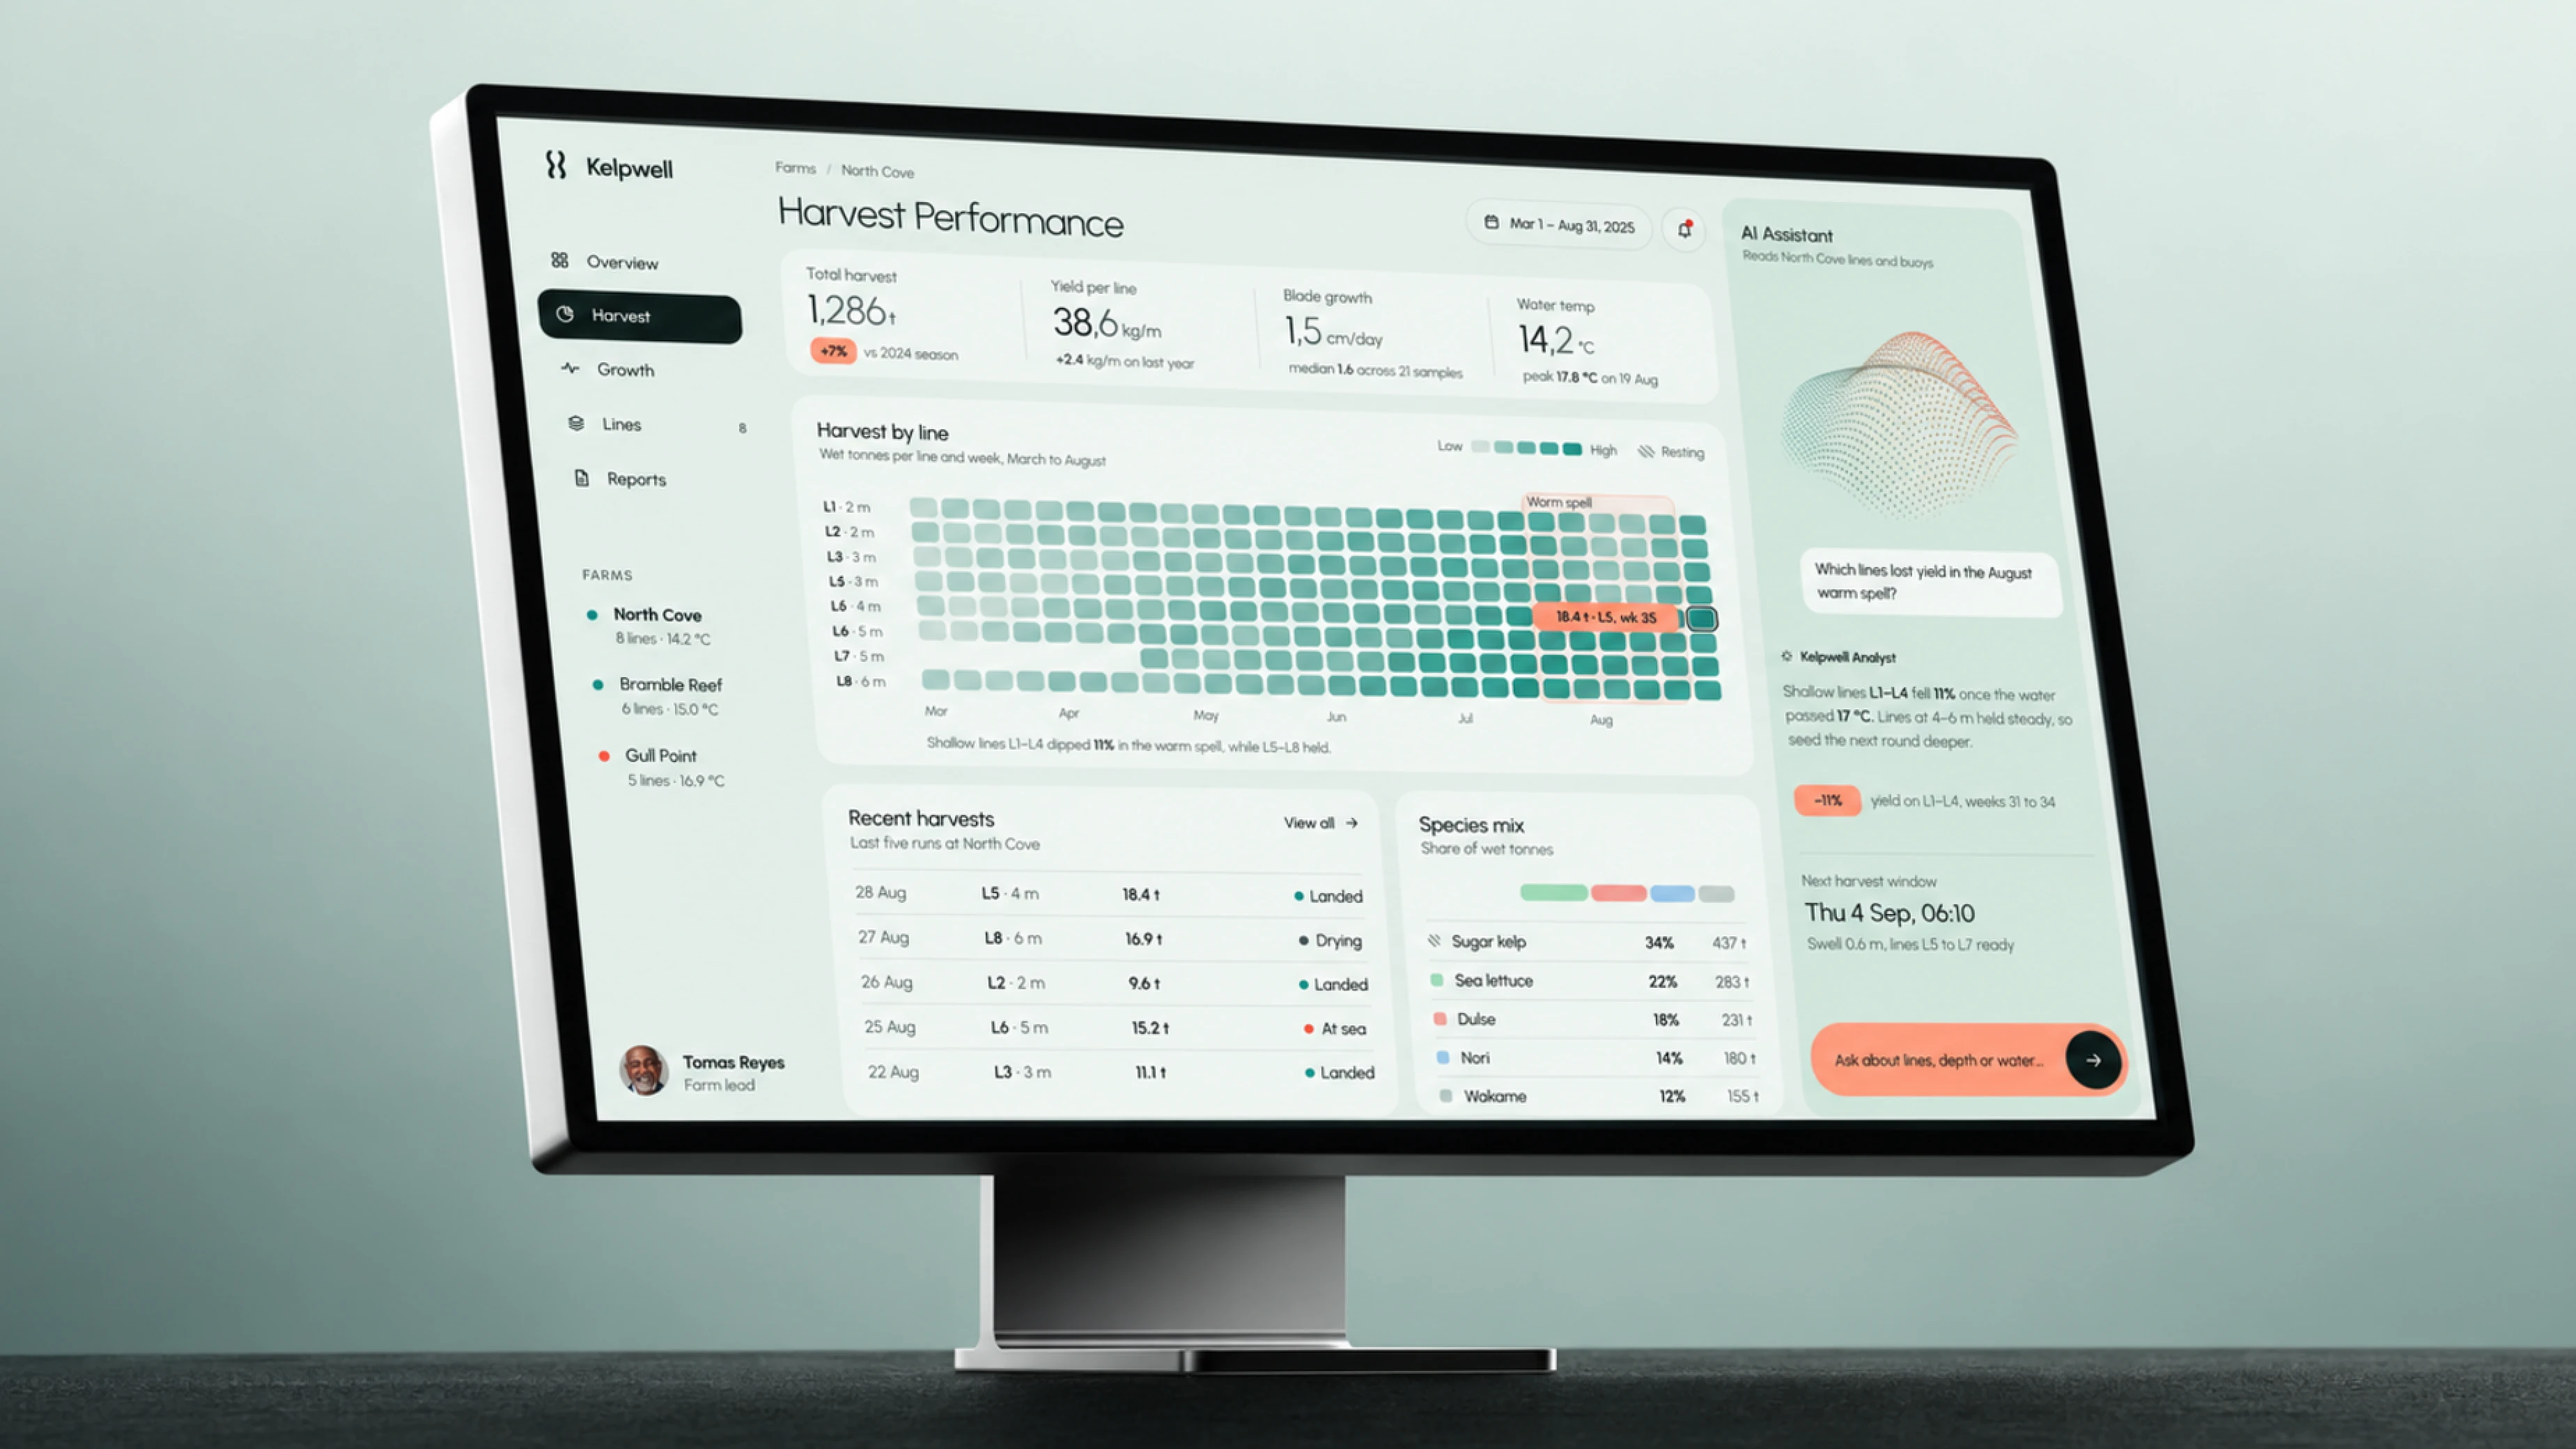
Kelpwell Dashboard is a light desktop dashboard for a kelp farm. It includes farms with water temperatures, season KPIs for total harvest, yield per line, blade growth and water temperature, a week by week harvest heatmap per line with a warm spell marker, an AI assistant with a short analysis, recent harvests and a species mix. Packaged as an editable Figma file.

Highlights

  • Refined, production-ready UI composition
  • Organized, reusable Figma components
  • Clean layout system you can adapt fast
What's included

  • Editable Figma source file
  • Organized layers & components
  • Reusable styles and tokens
  • Commercial license with a membership

Frequently asked questions

  • The editable Figma source for this concept. Copy it into your own workspace and adapt it freely.

  • It's included with a HorizonX membership. Open it and copy it to Figma instantly, no separate purchase.

  • Yes, with a HorizonX membership. Members get a commercial license: use and adapt these files in personal, client and commercial projects. If your plan ends, projects you already built keep their license, but the files can't be used to start new ones.