Honey Harvest Dashboard: Dashboard Template | HorizonX

Premium UI/UX

Honey Harvest Dashboard

New

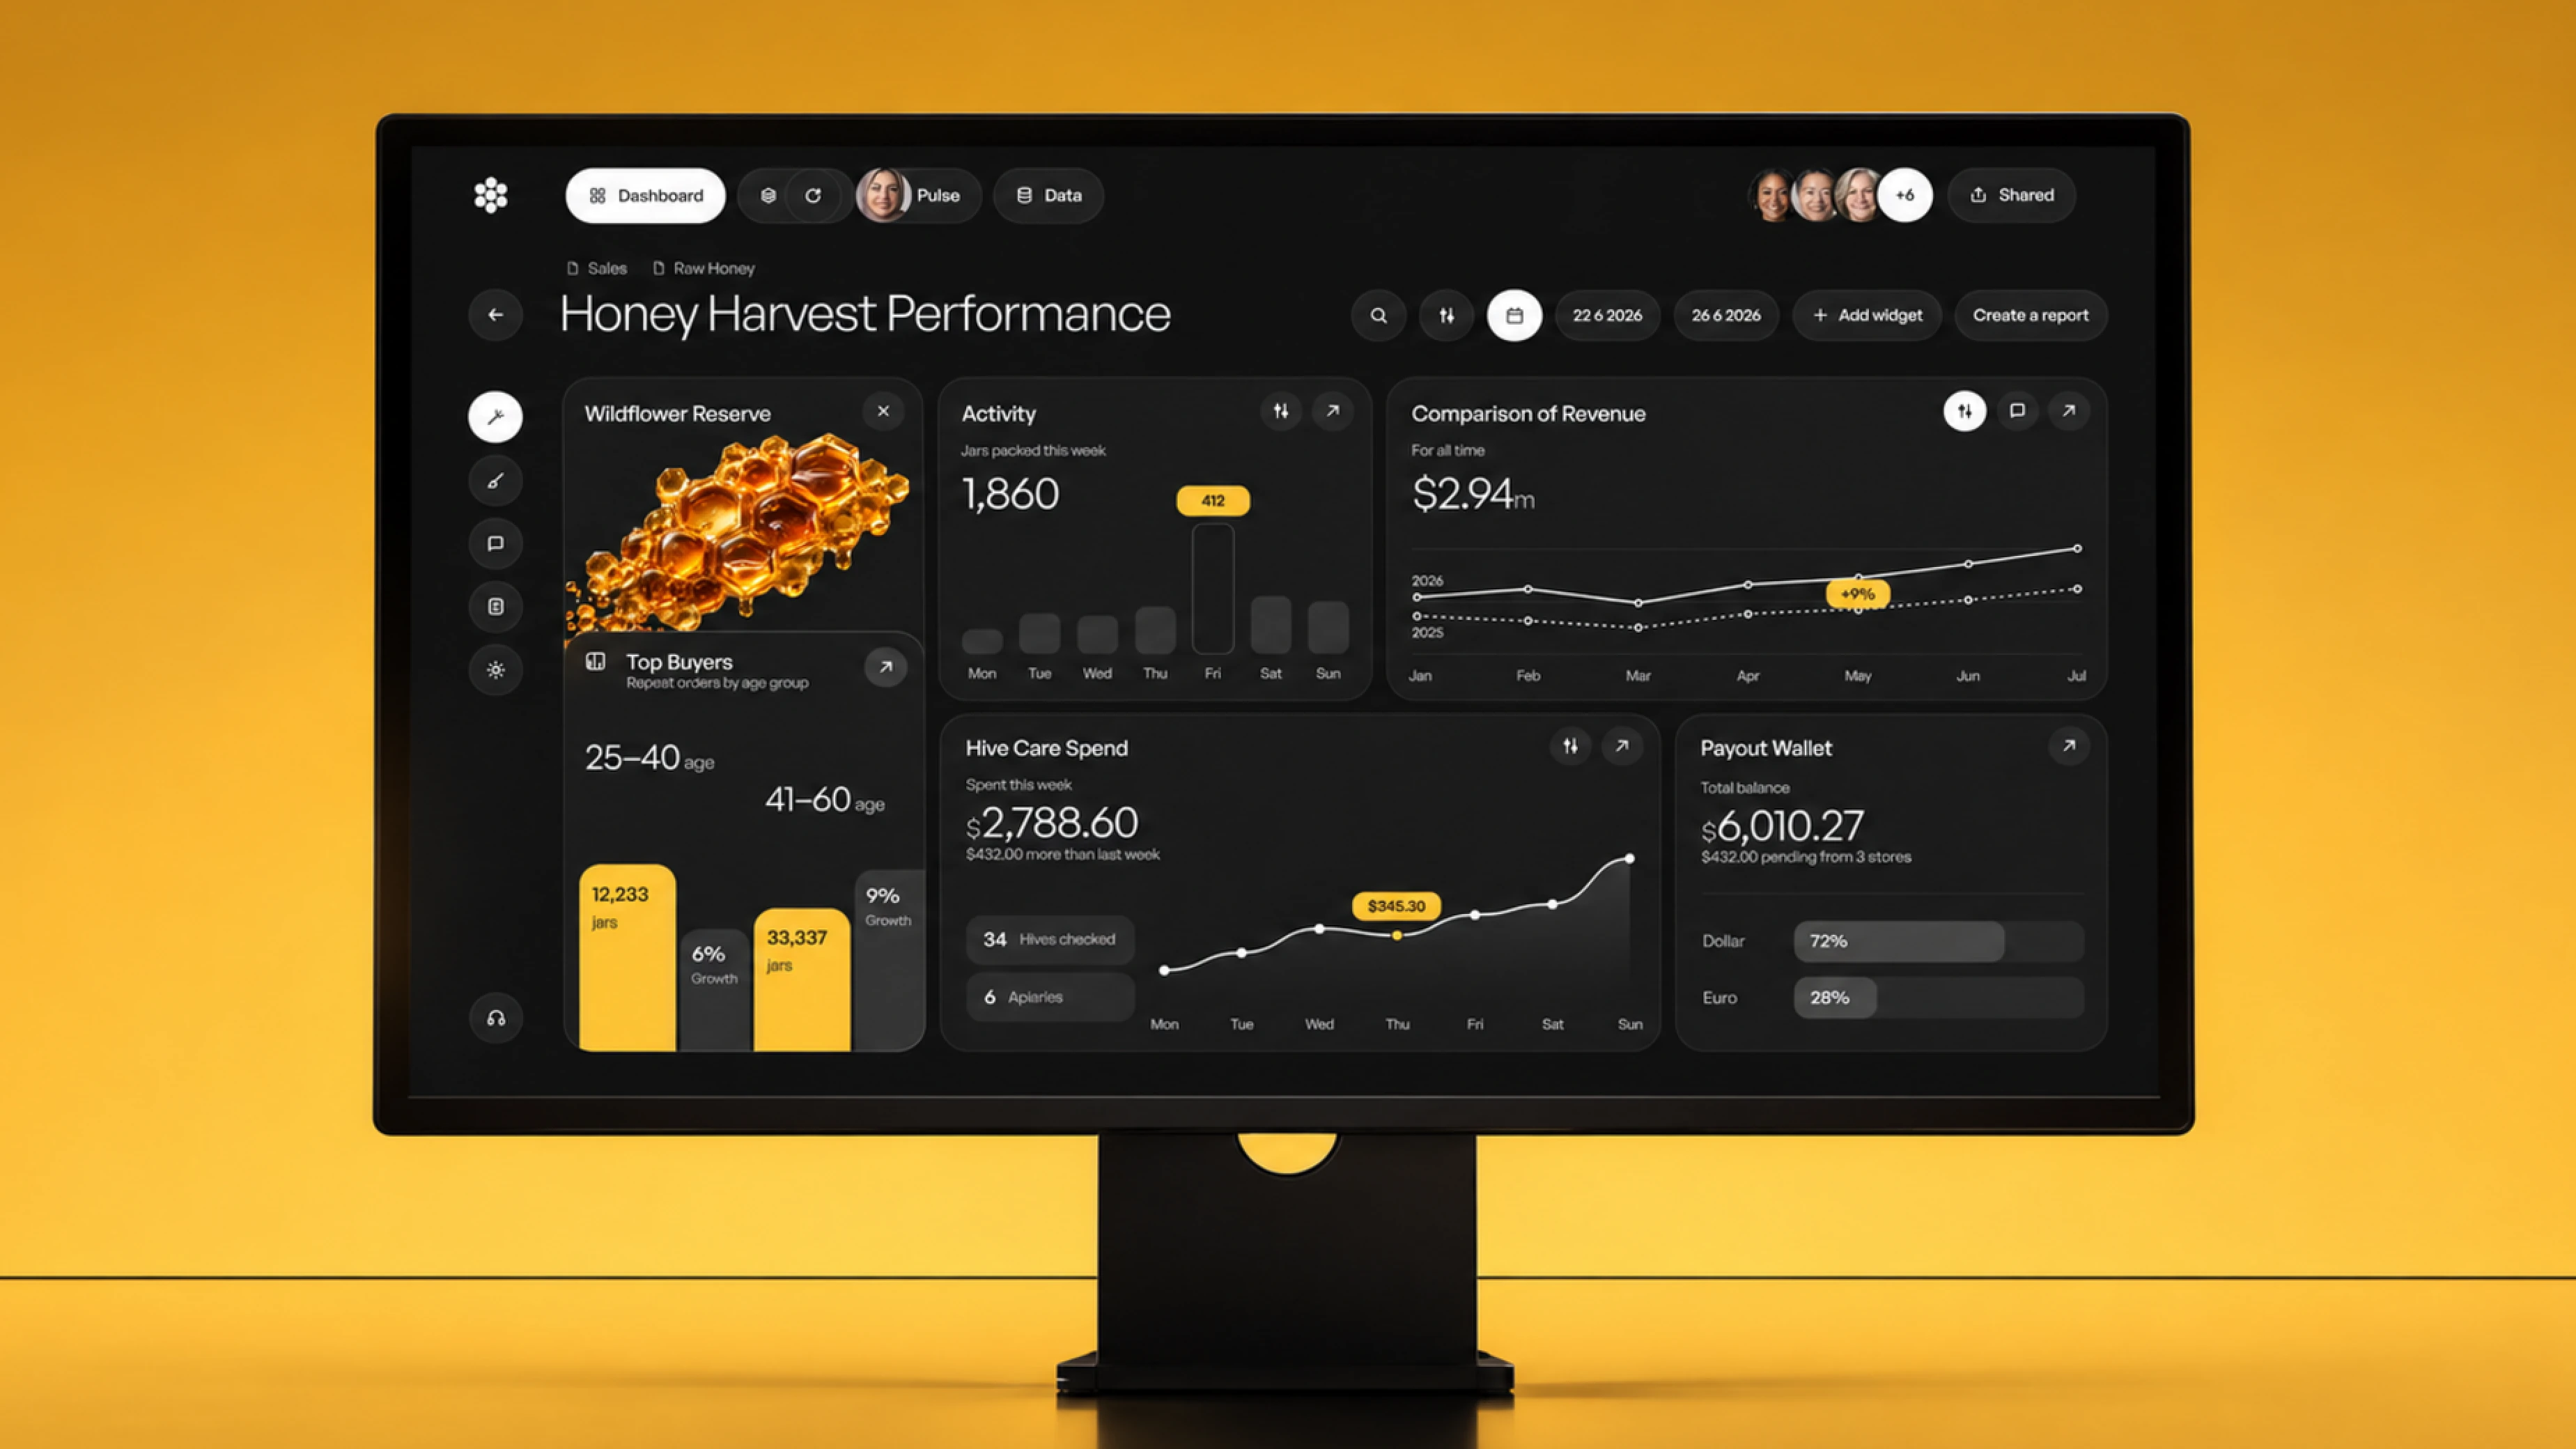
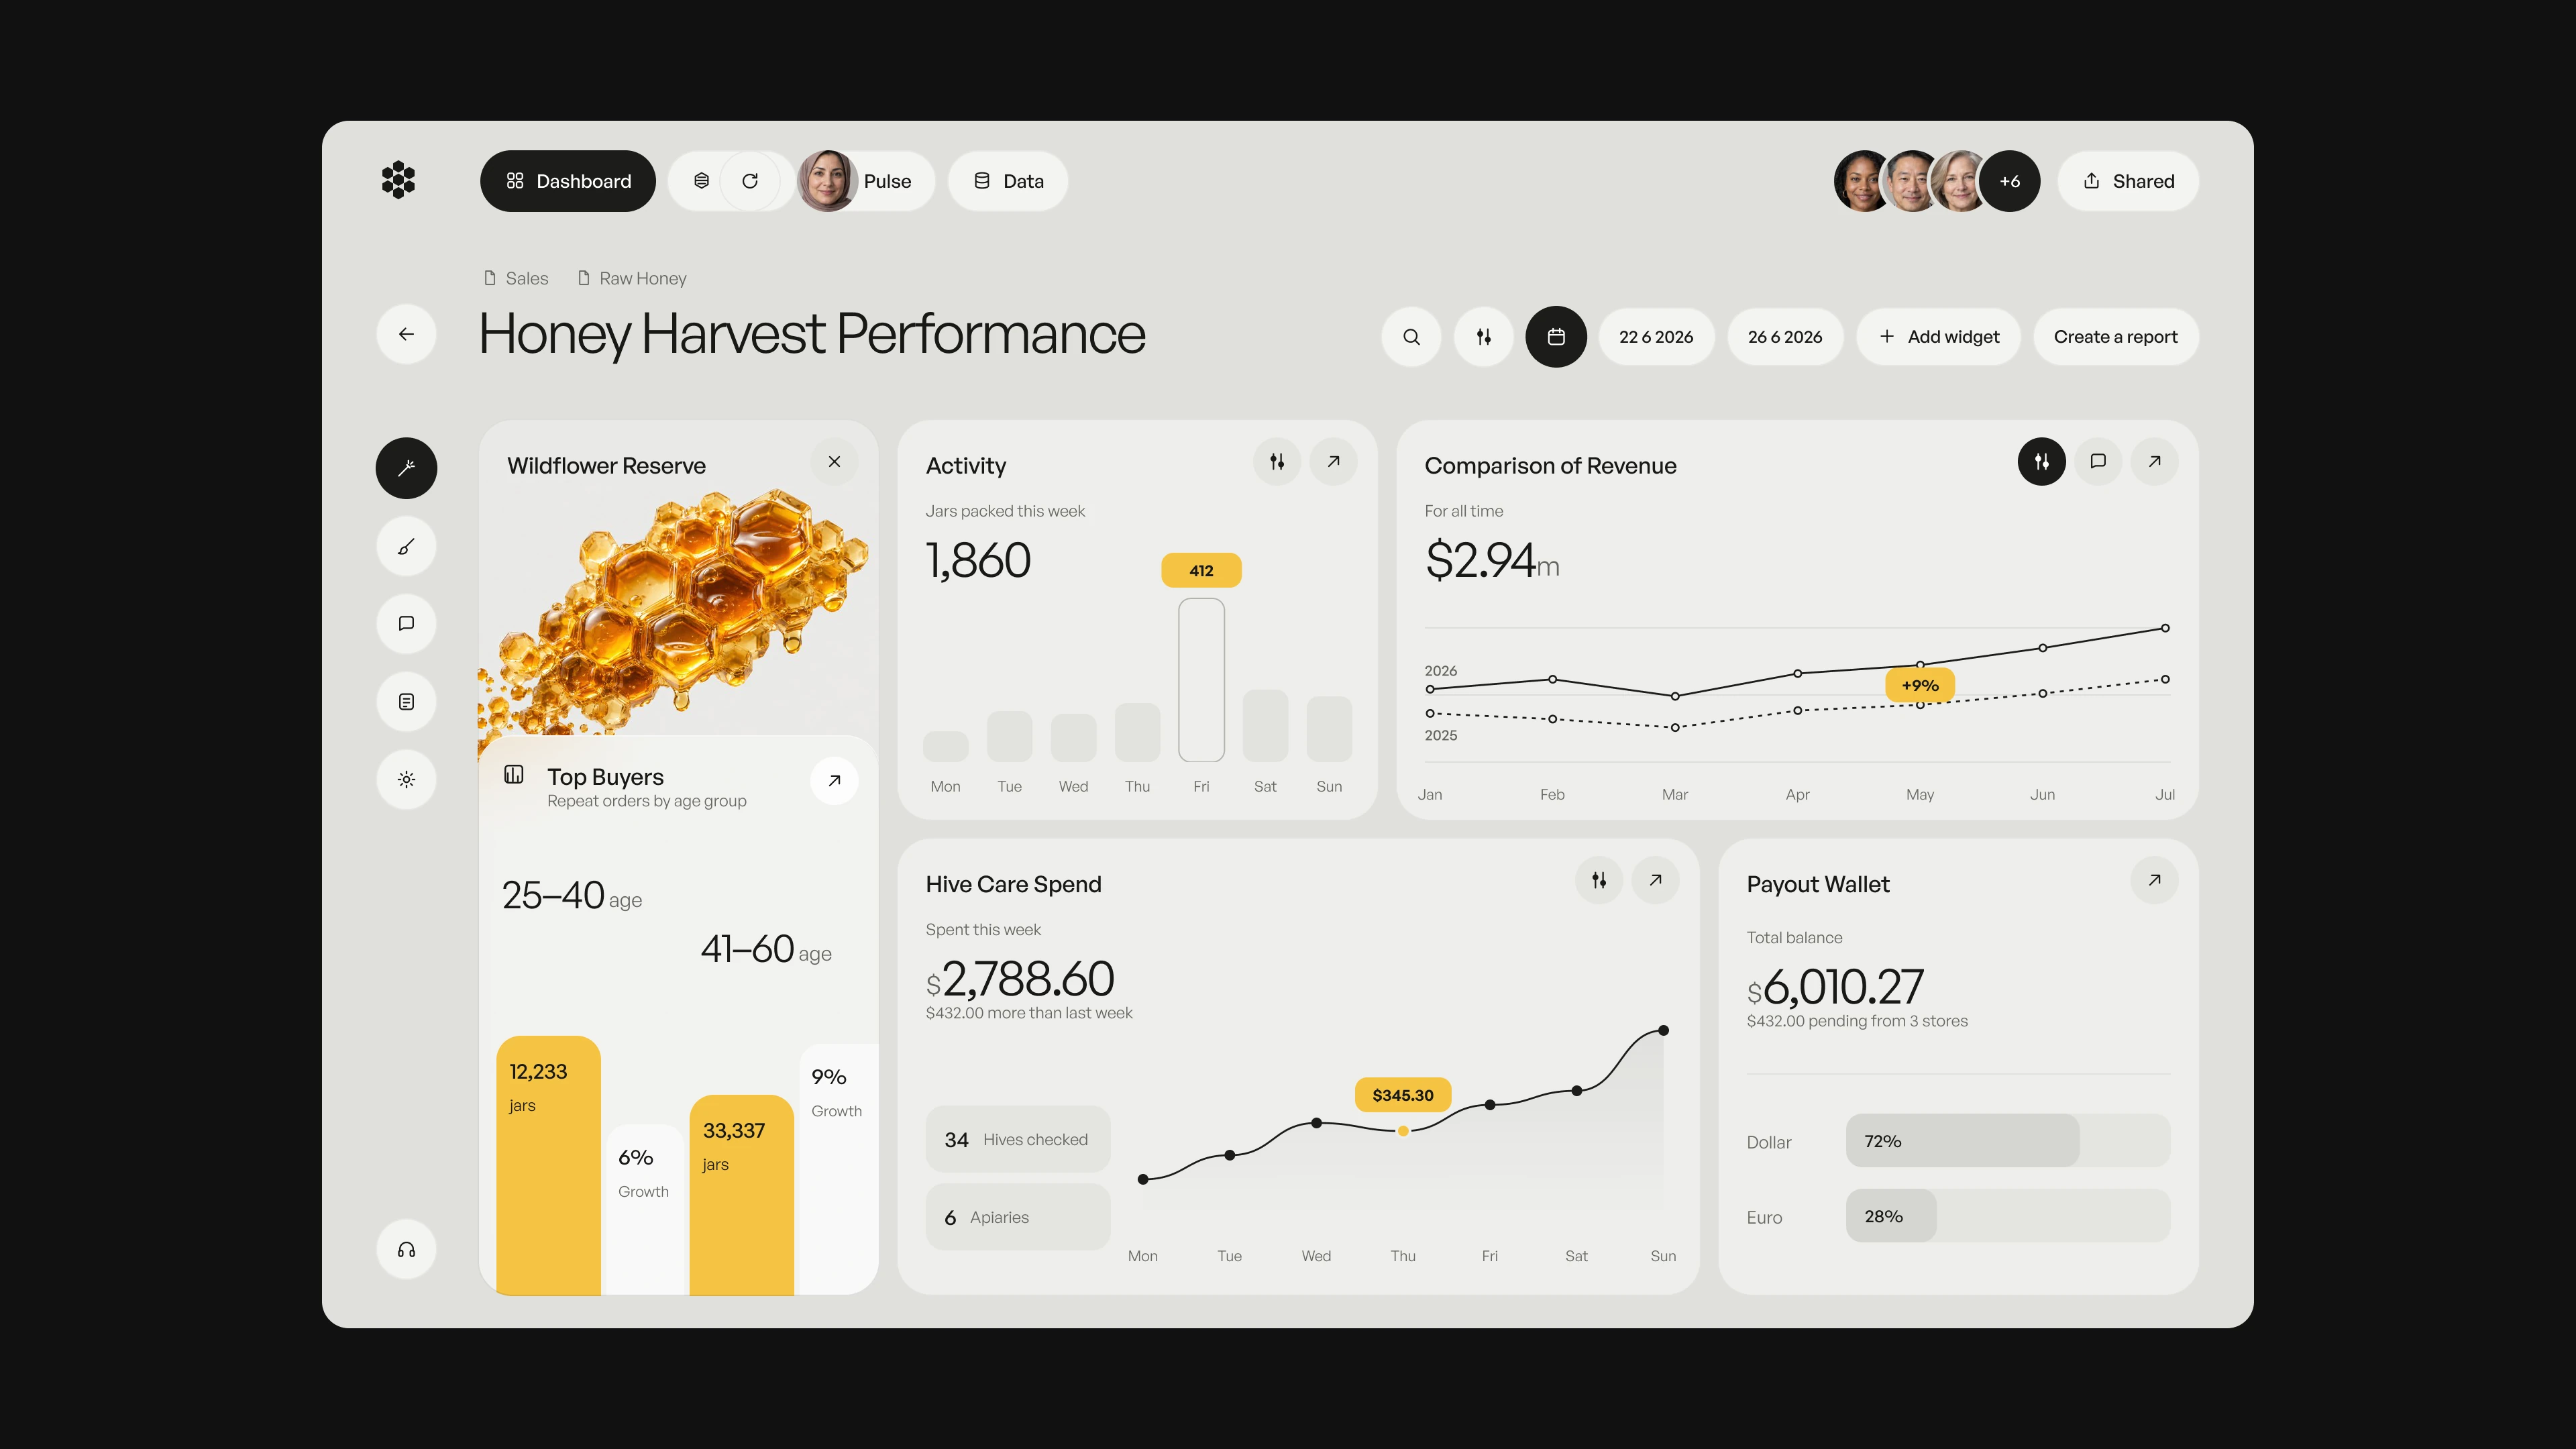
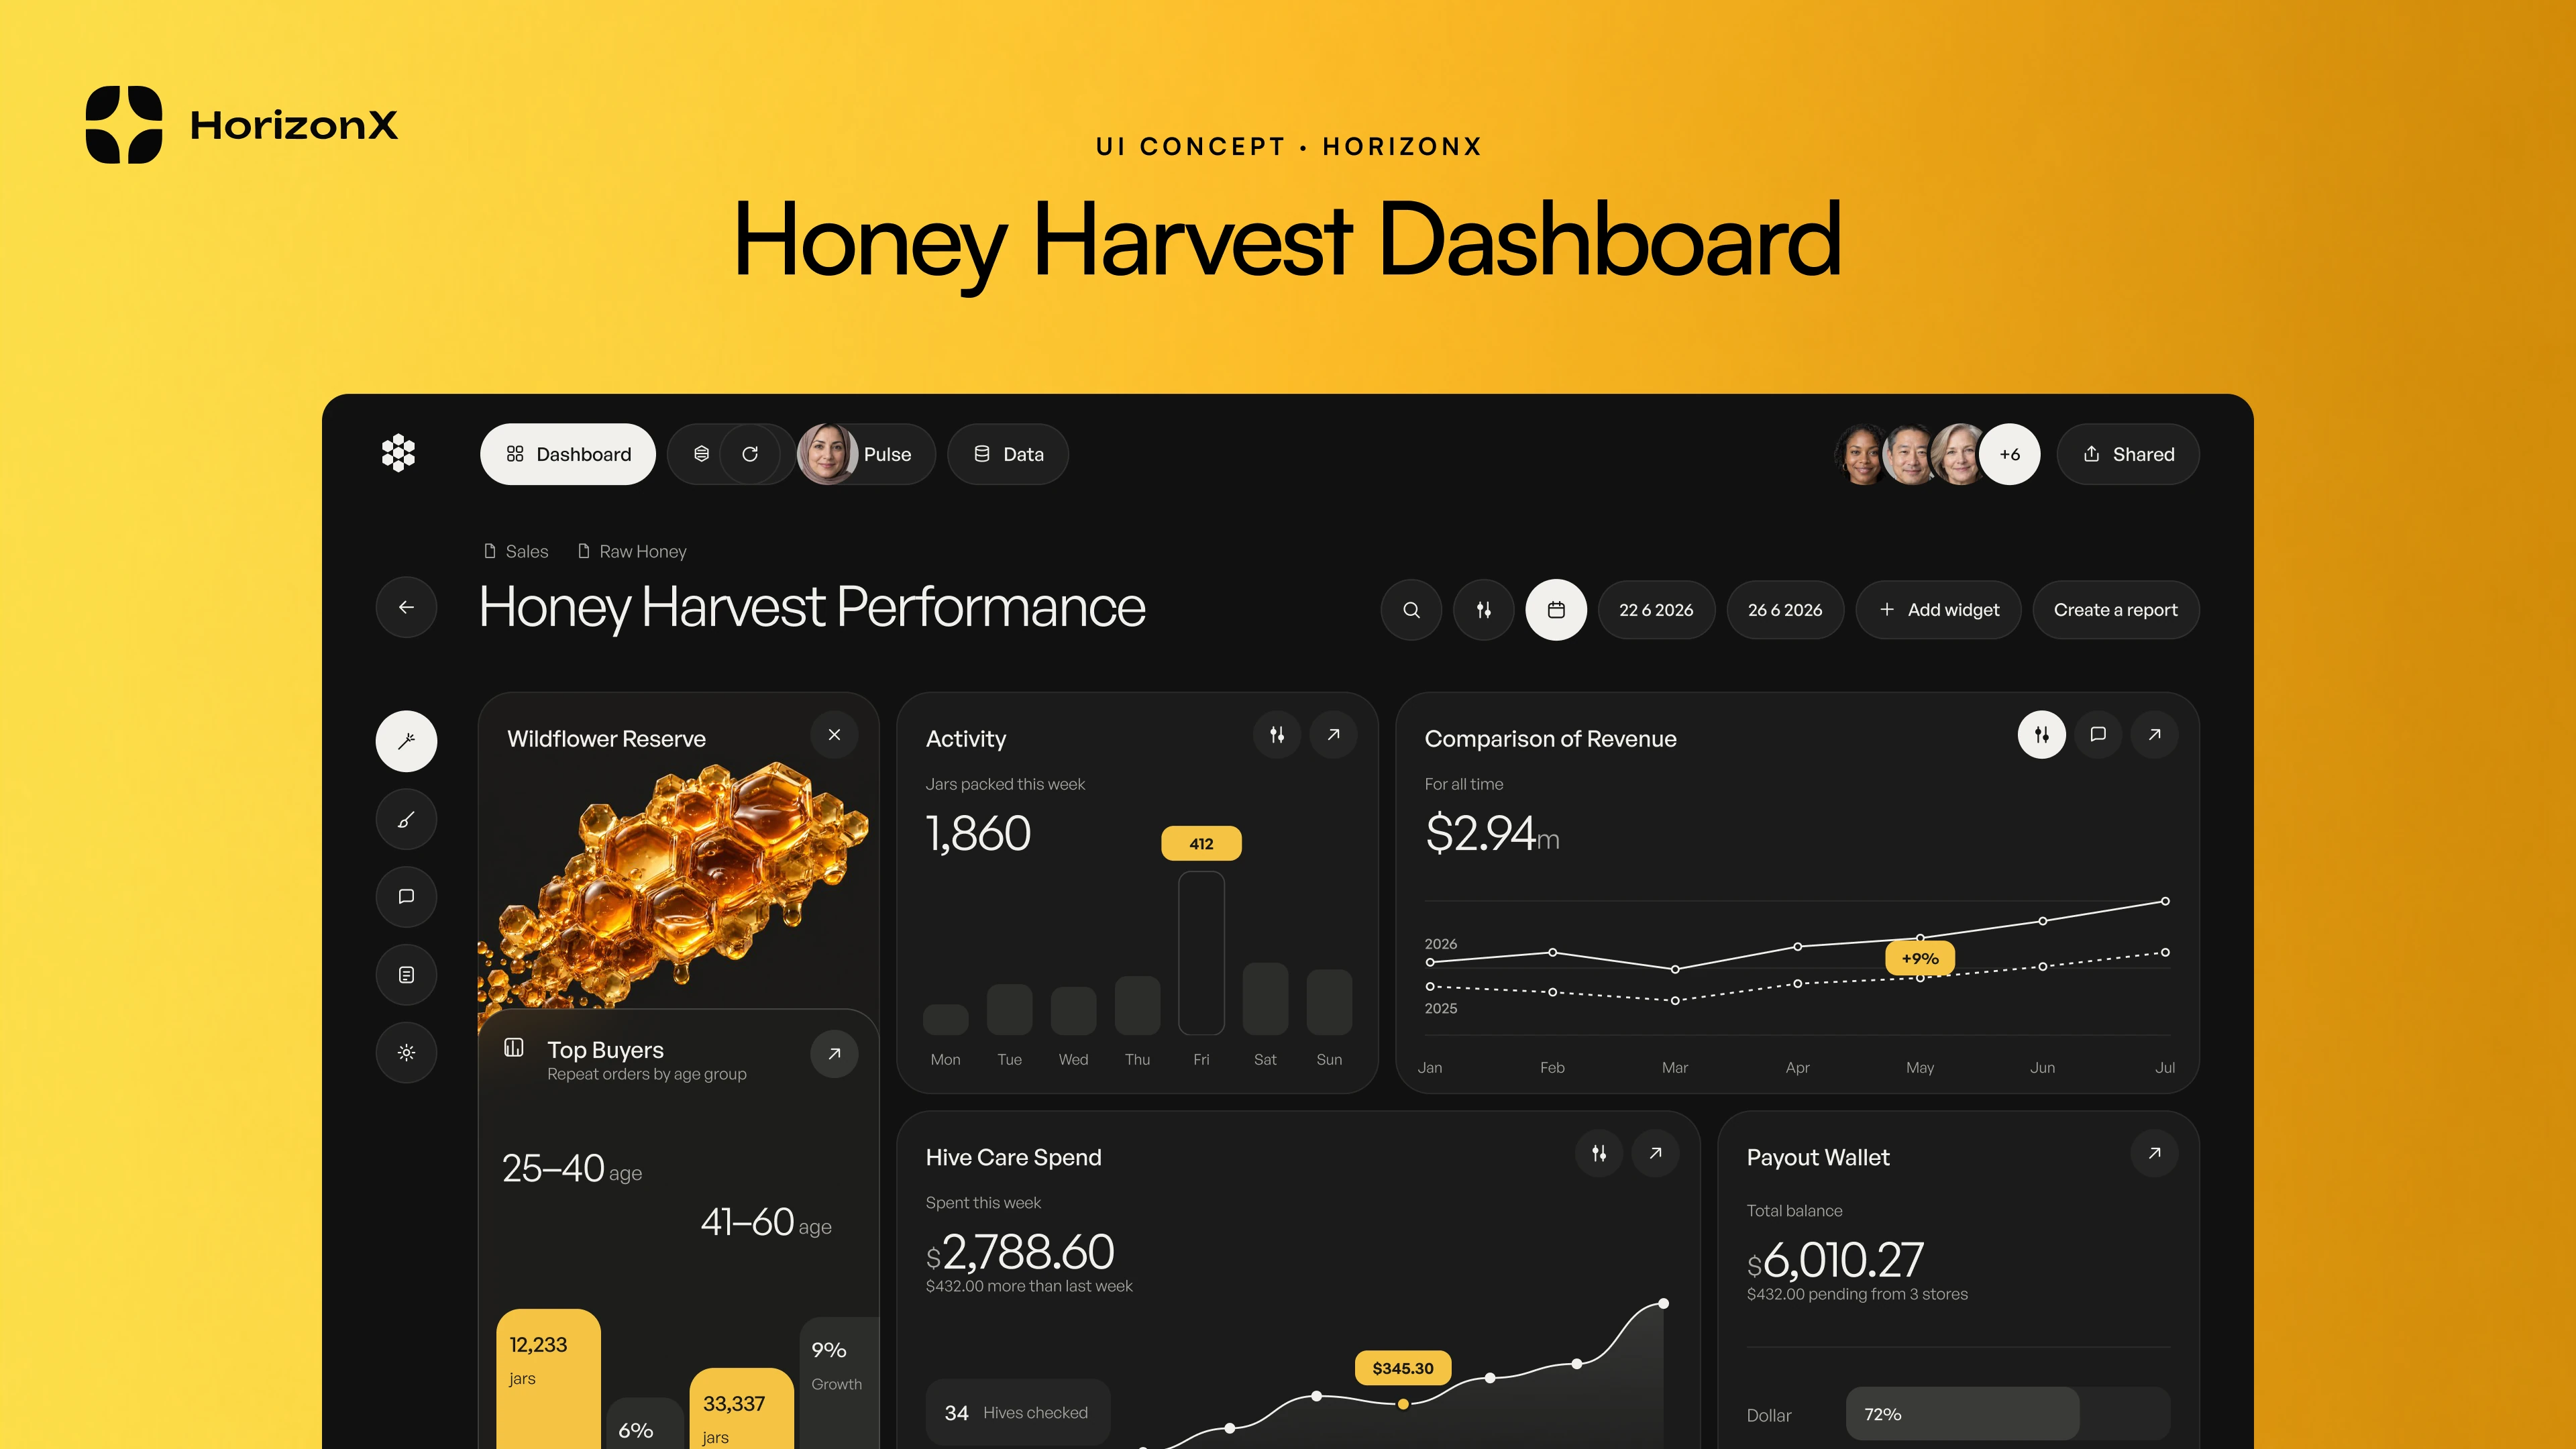
Honey production and sales dashboard in light and dark: jars packed, revenue comparison, buyers and hive care

Honey Harvest Dashboard, image 4
Honey Harvest Dashboard, image 1
Honey Harvest Dashboard, image 2
Honey Harvest Dashboard, image 3
Honey Harvest Dashboard, image 4
Honey Harvest Dashboard, image 1
  • Instant access Included with every membership
  • Editable Figma source Copy straight to your workspace
  • Commercial license With a membership, for client work

Overview

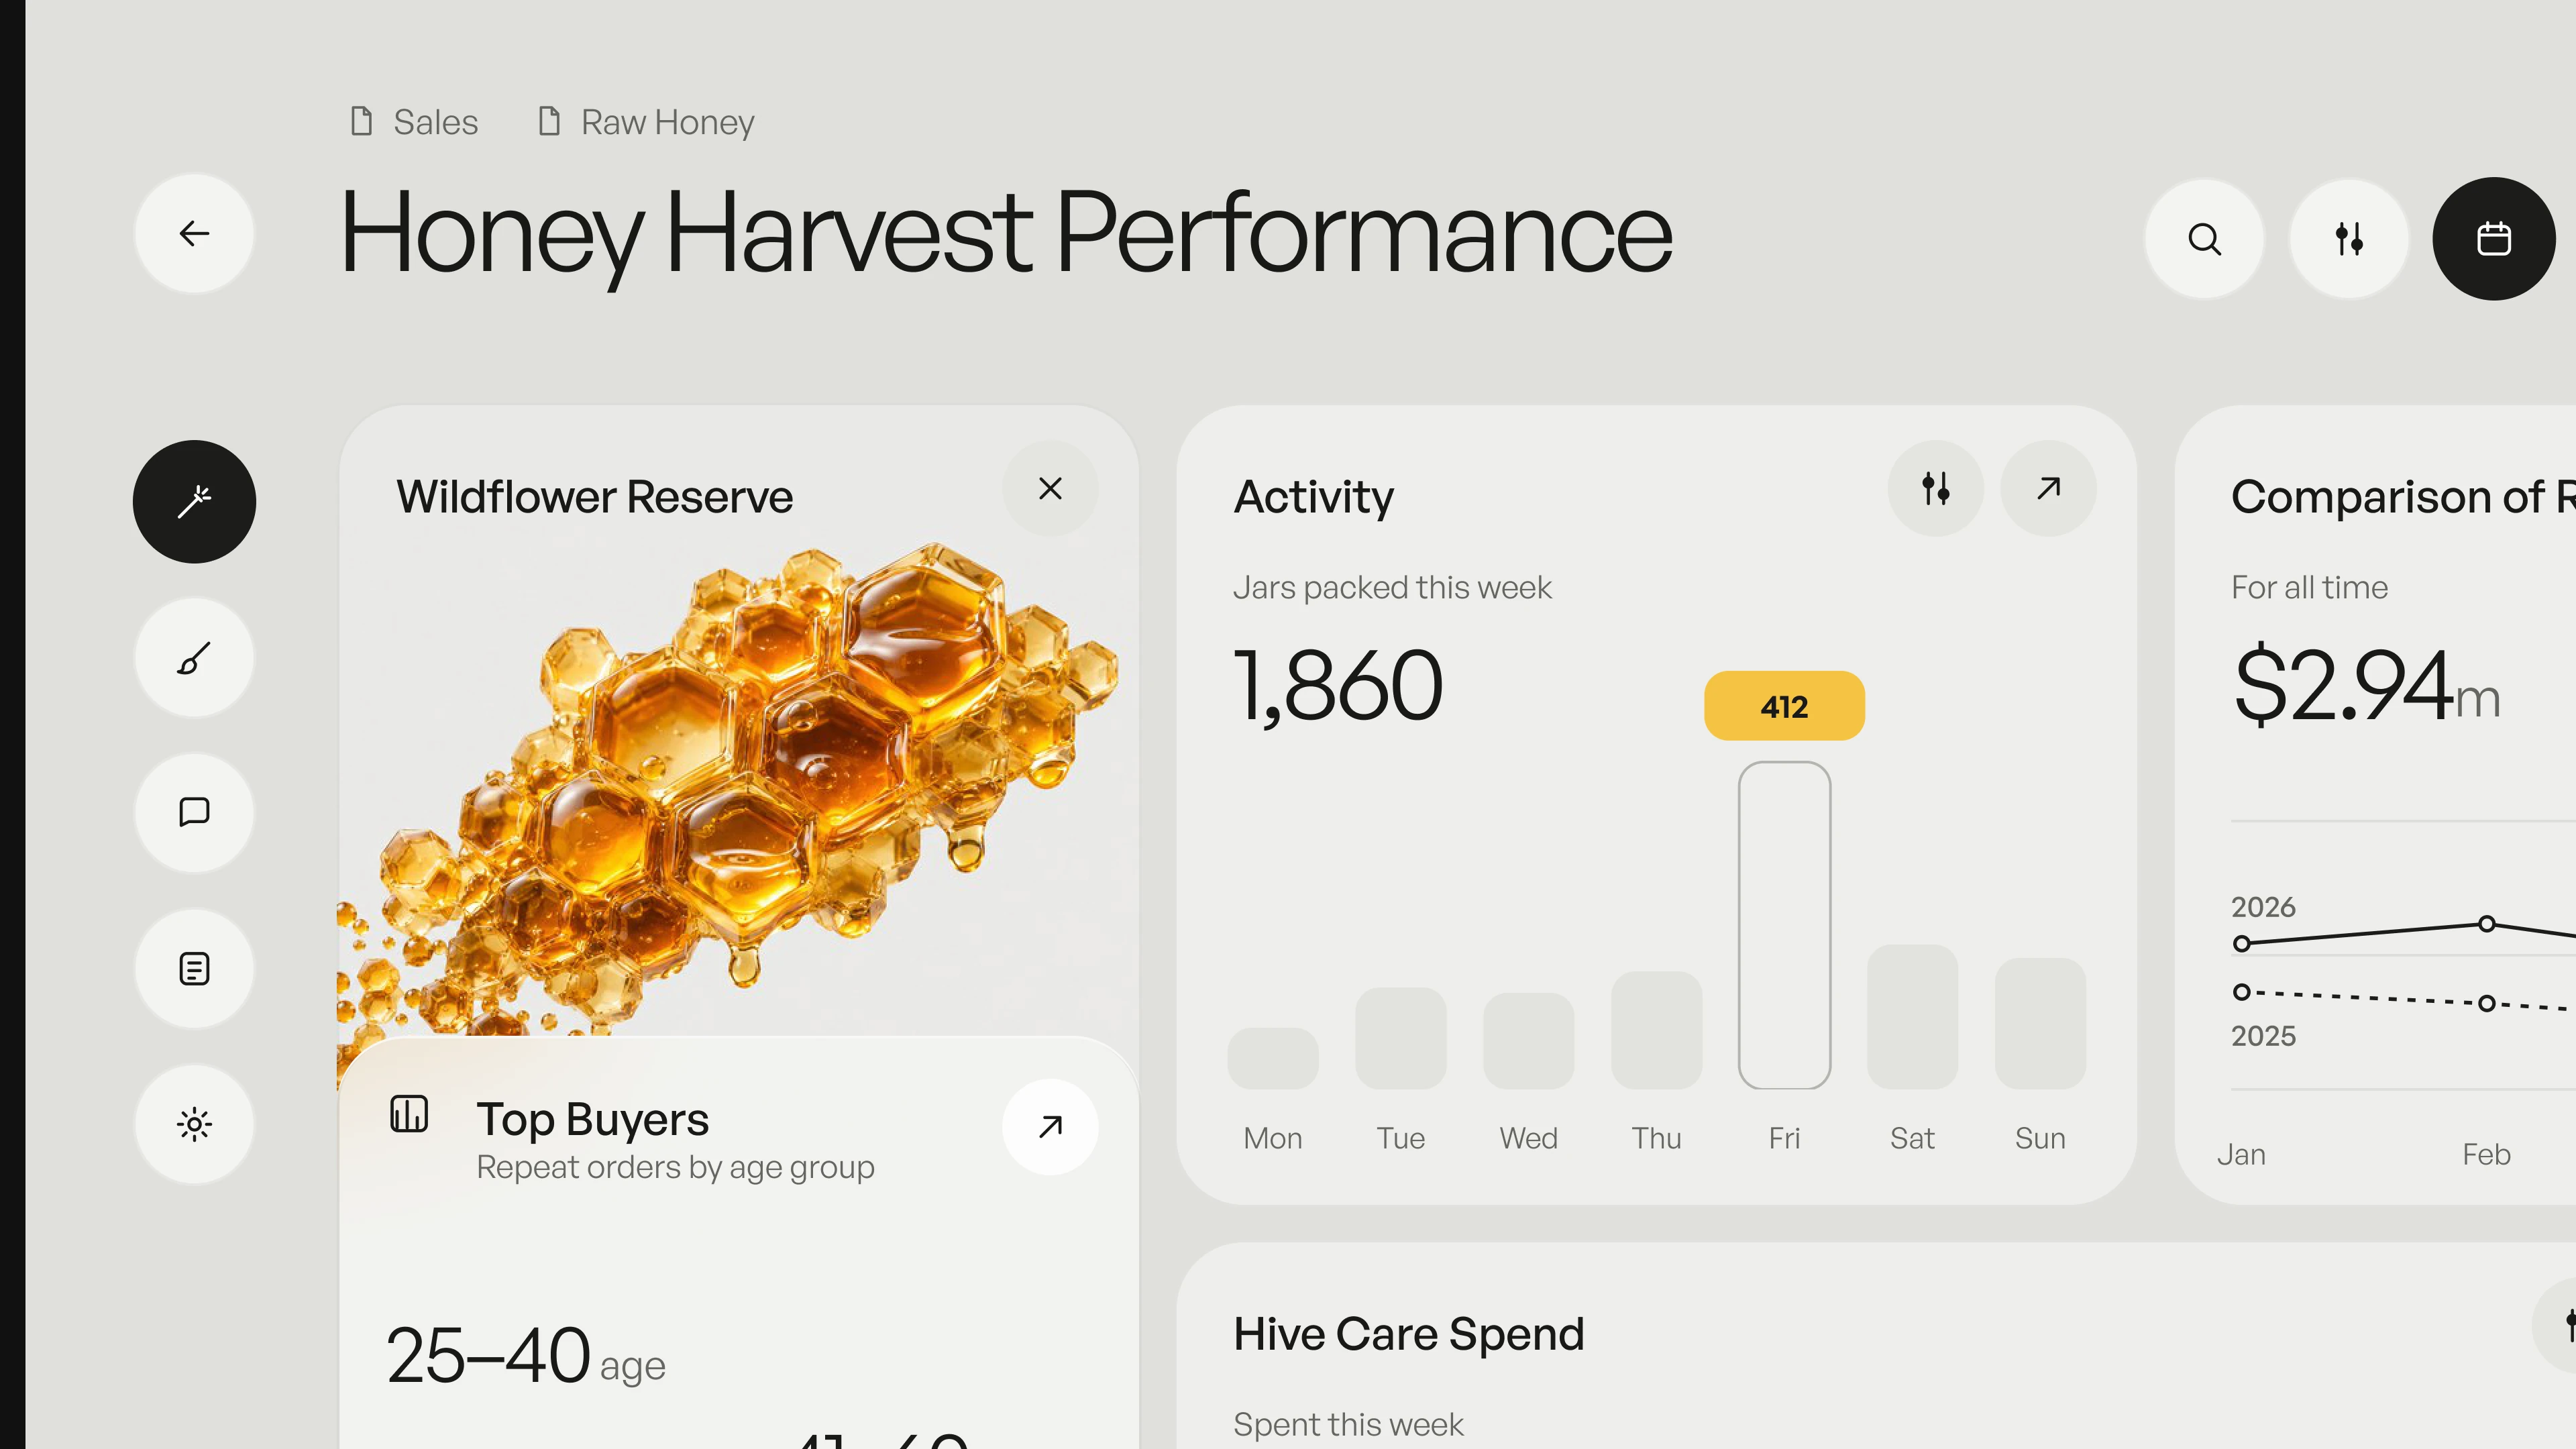
Honey Harvest Dashboard is a desktop dashboard for a honey producer, in a light and a dark version. It includes a product card with a honeycomb image, top buyers by age group, jars packed this week, a year over year revenue comparison chart, hive care spend with a weekly trend and a payout wallet, with date range, widget and report actions. Packaged as an editable Figma file.

Highlights

  • Refined, production-ready UI composition
  • Organized, reusable Figma components
  • Clean layout system you can adapt fast

What's included

  • Editable Figma source file
  • Organized layers & components
  • Reusable styles and tokens
  • Commercial license with a membership

Frequently asked questions

  • The editable Figma source for this concept. Copy it into your own workspace and adapt it freely.

  • It's included with a HorizonX membership. Open it and copy it to Figma instantly, no separate purchase.

  • Yes, with a HorizonX membership. Members get a commercial license: use and adapt these files in personal, client and commercial projects. If your plan ends, projects you already built keep their license, but the files can't be used to start new ones.