Overview
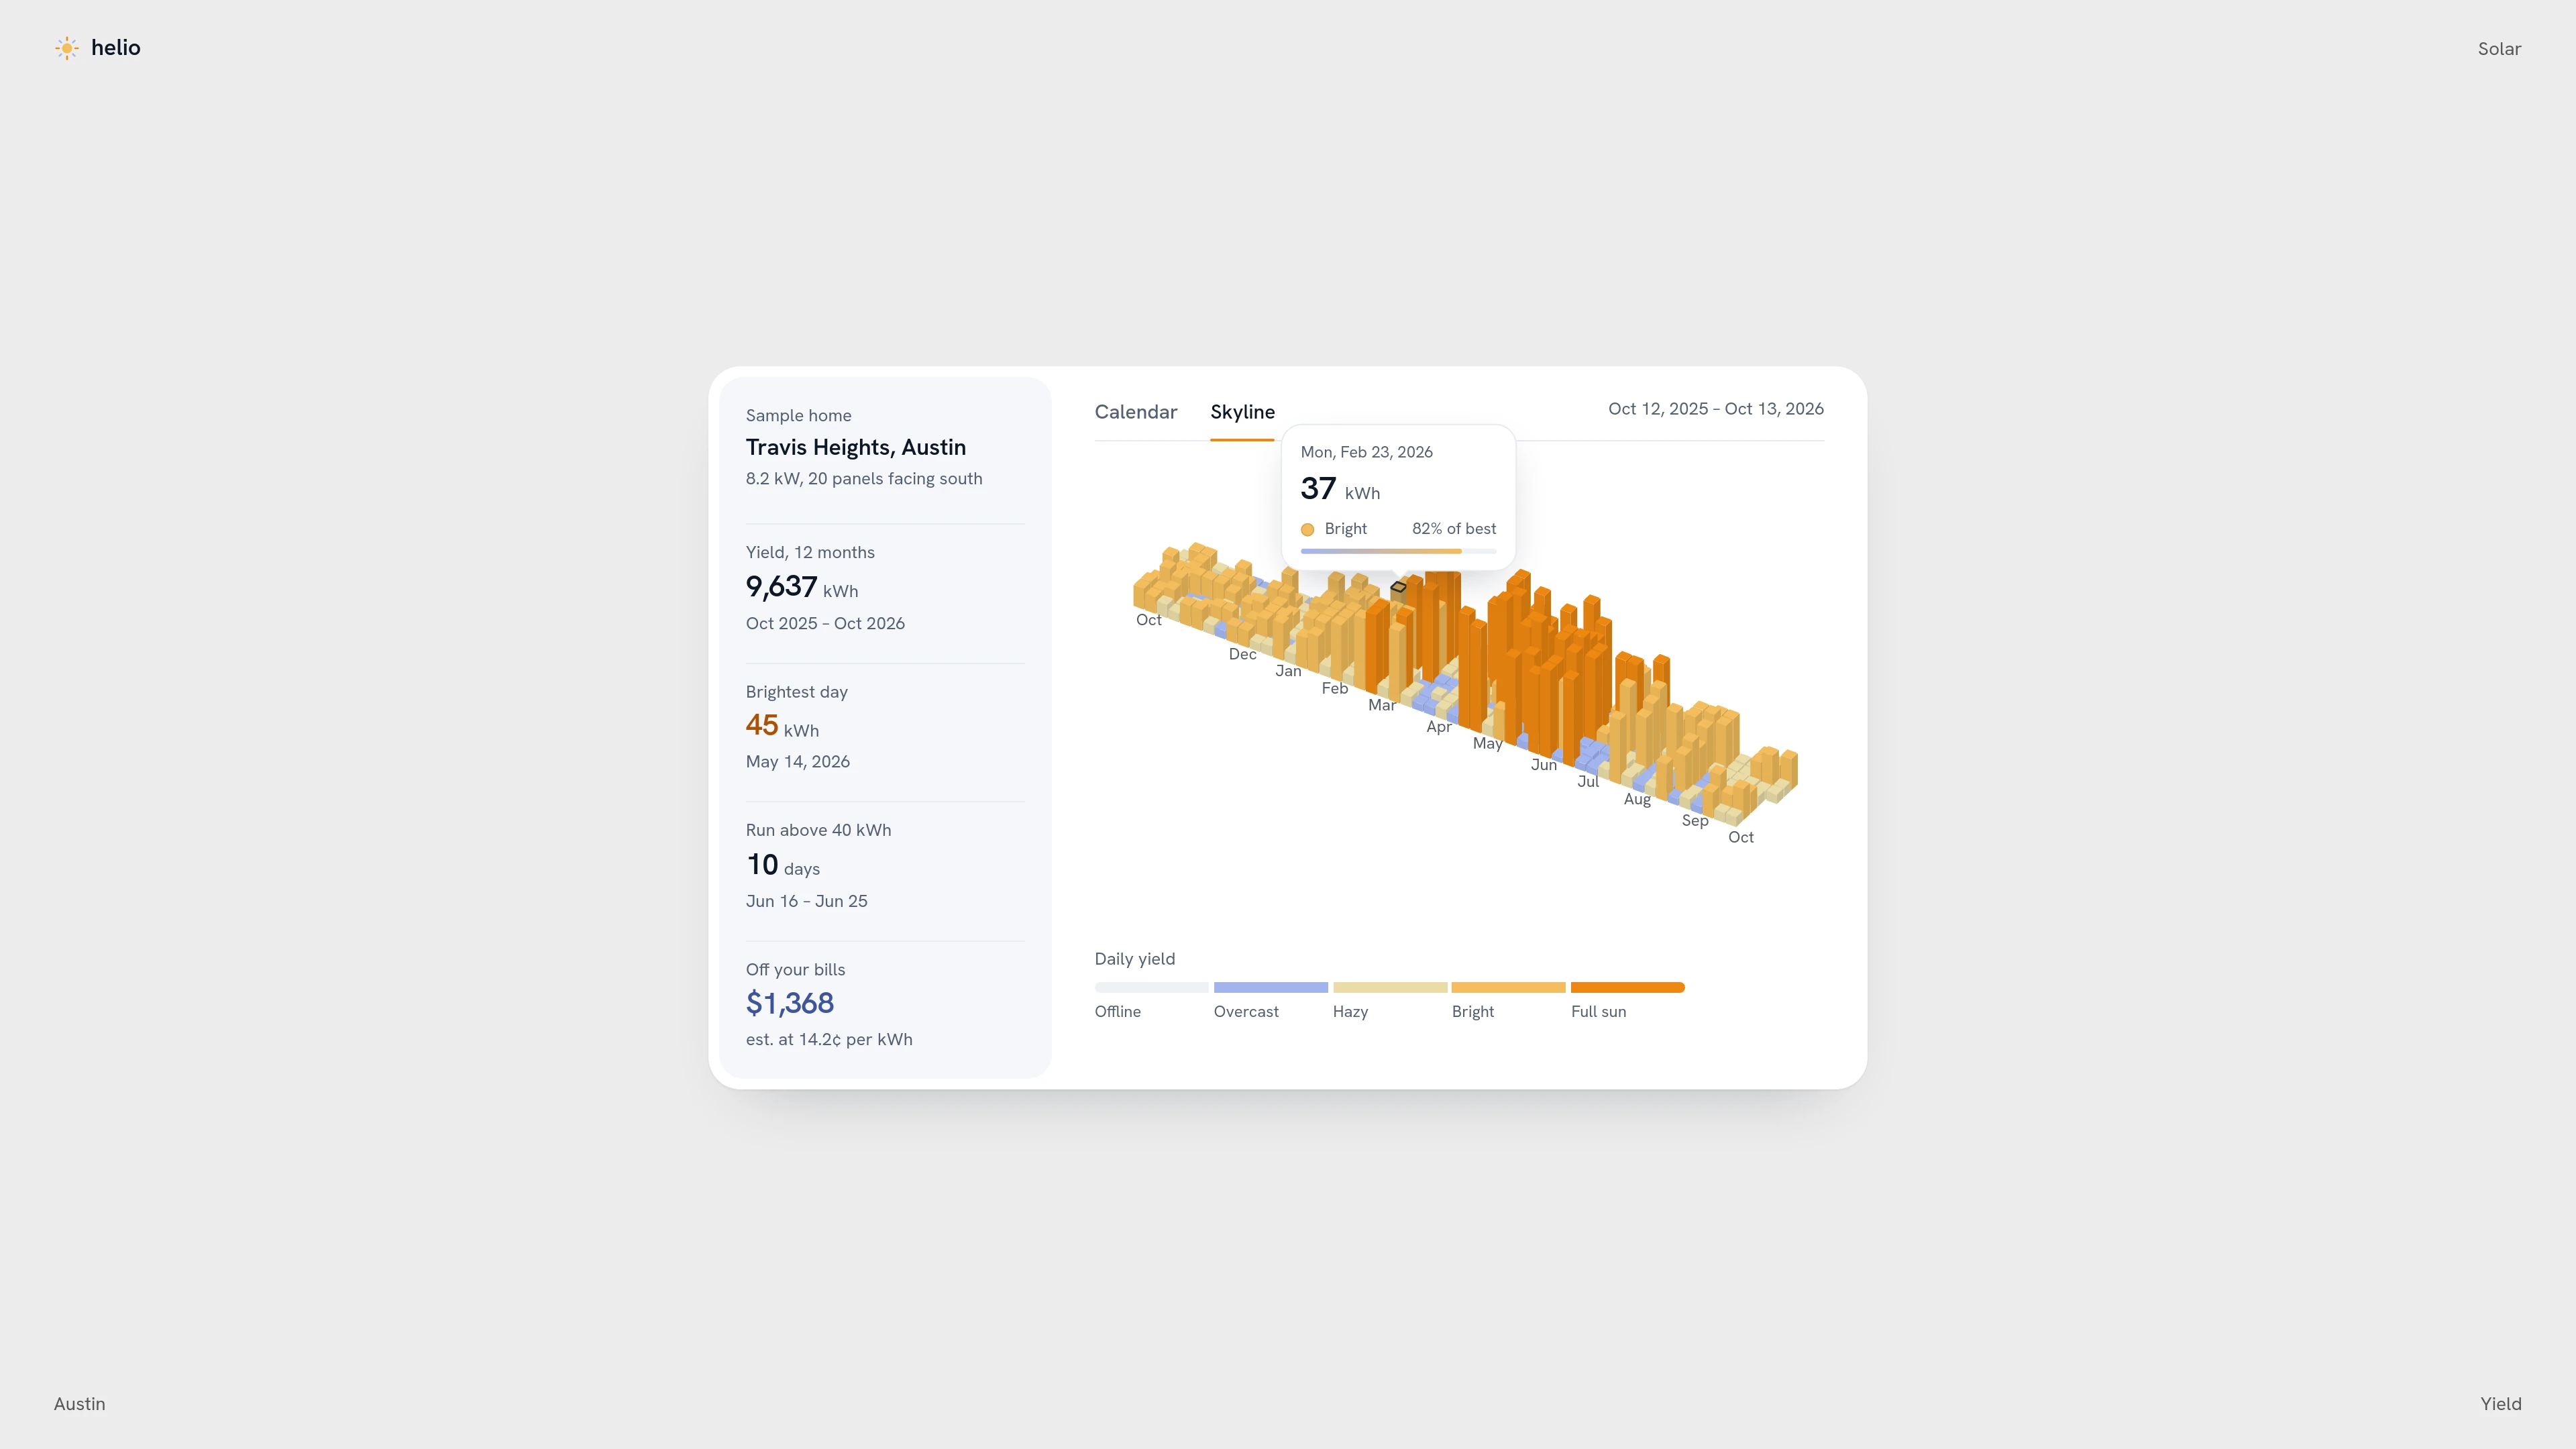
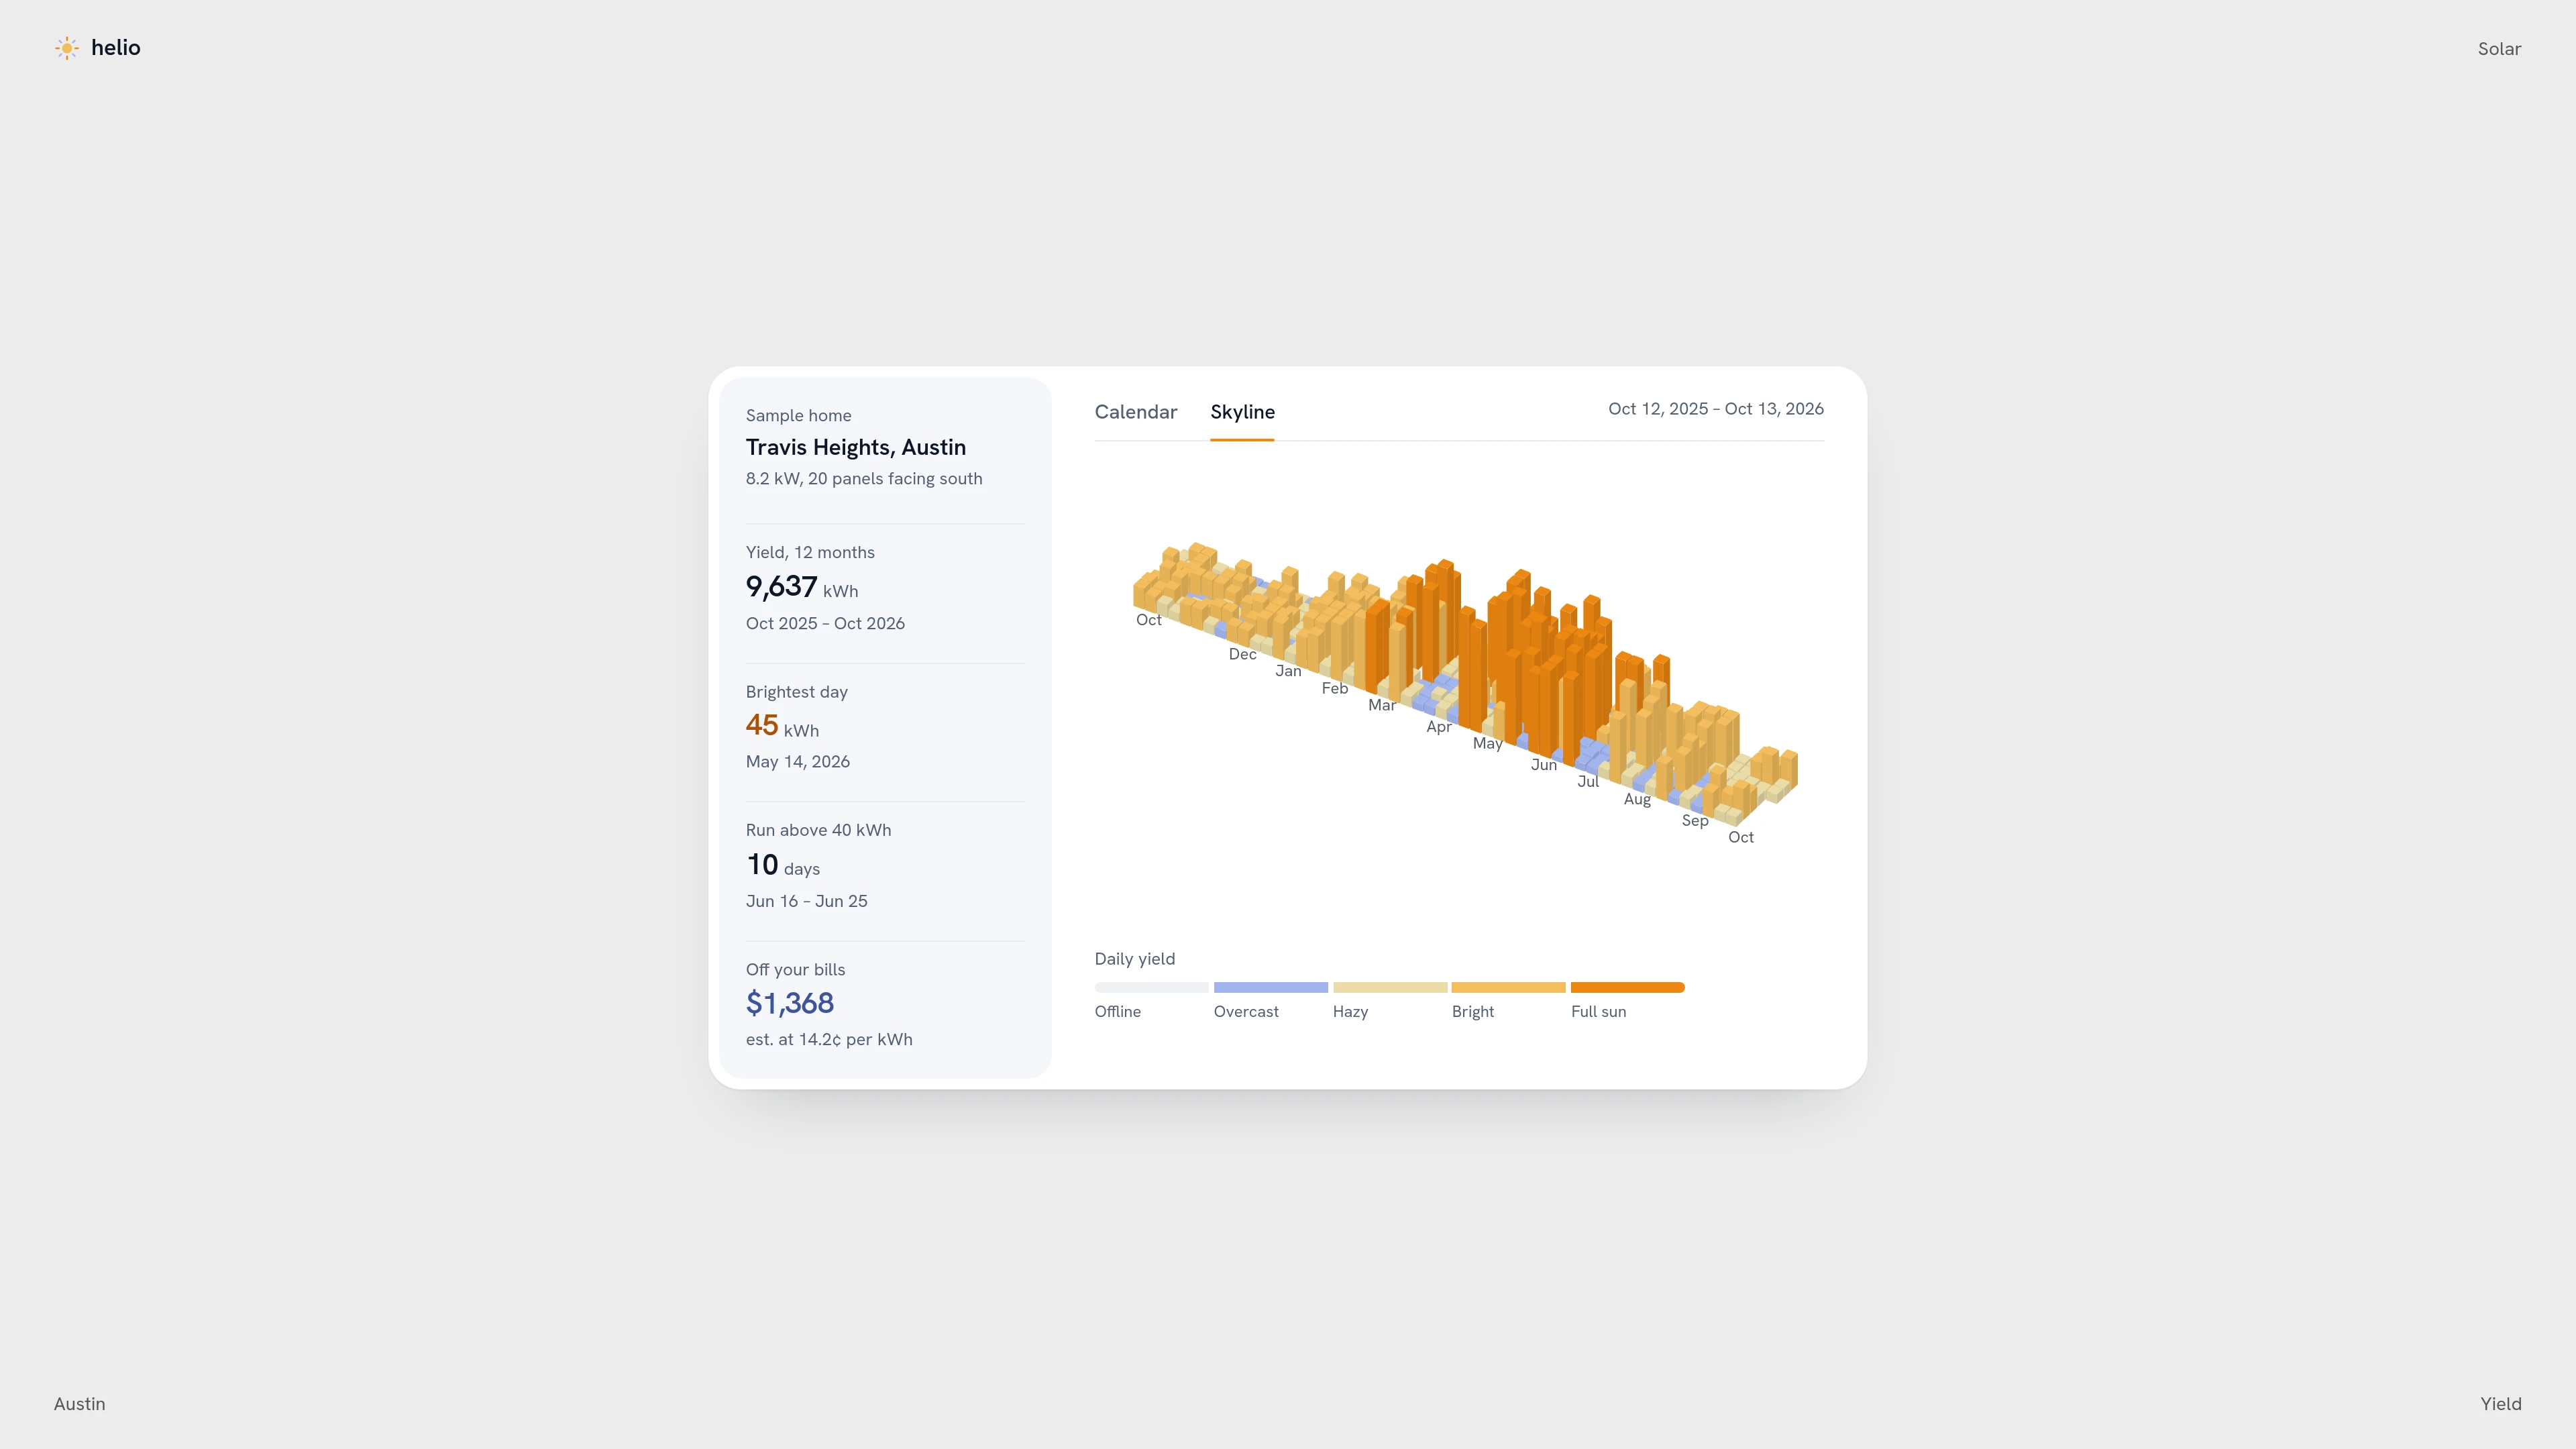
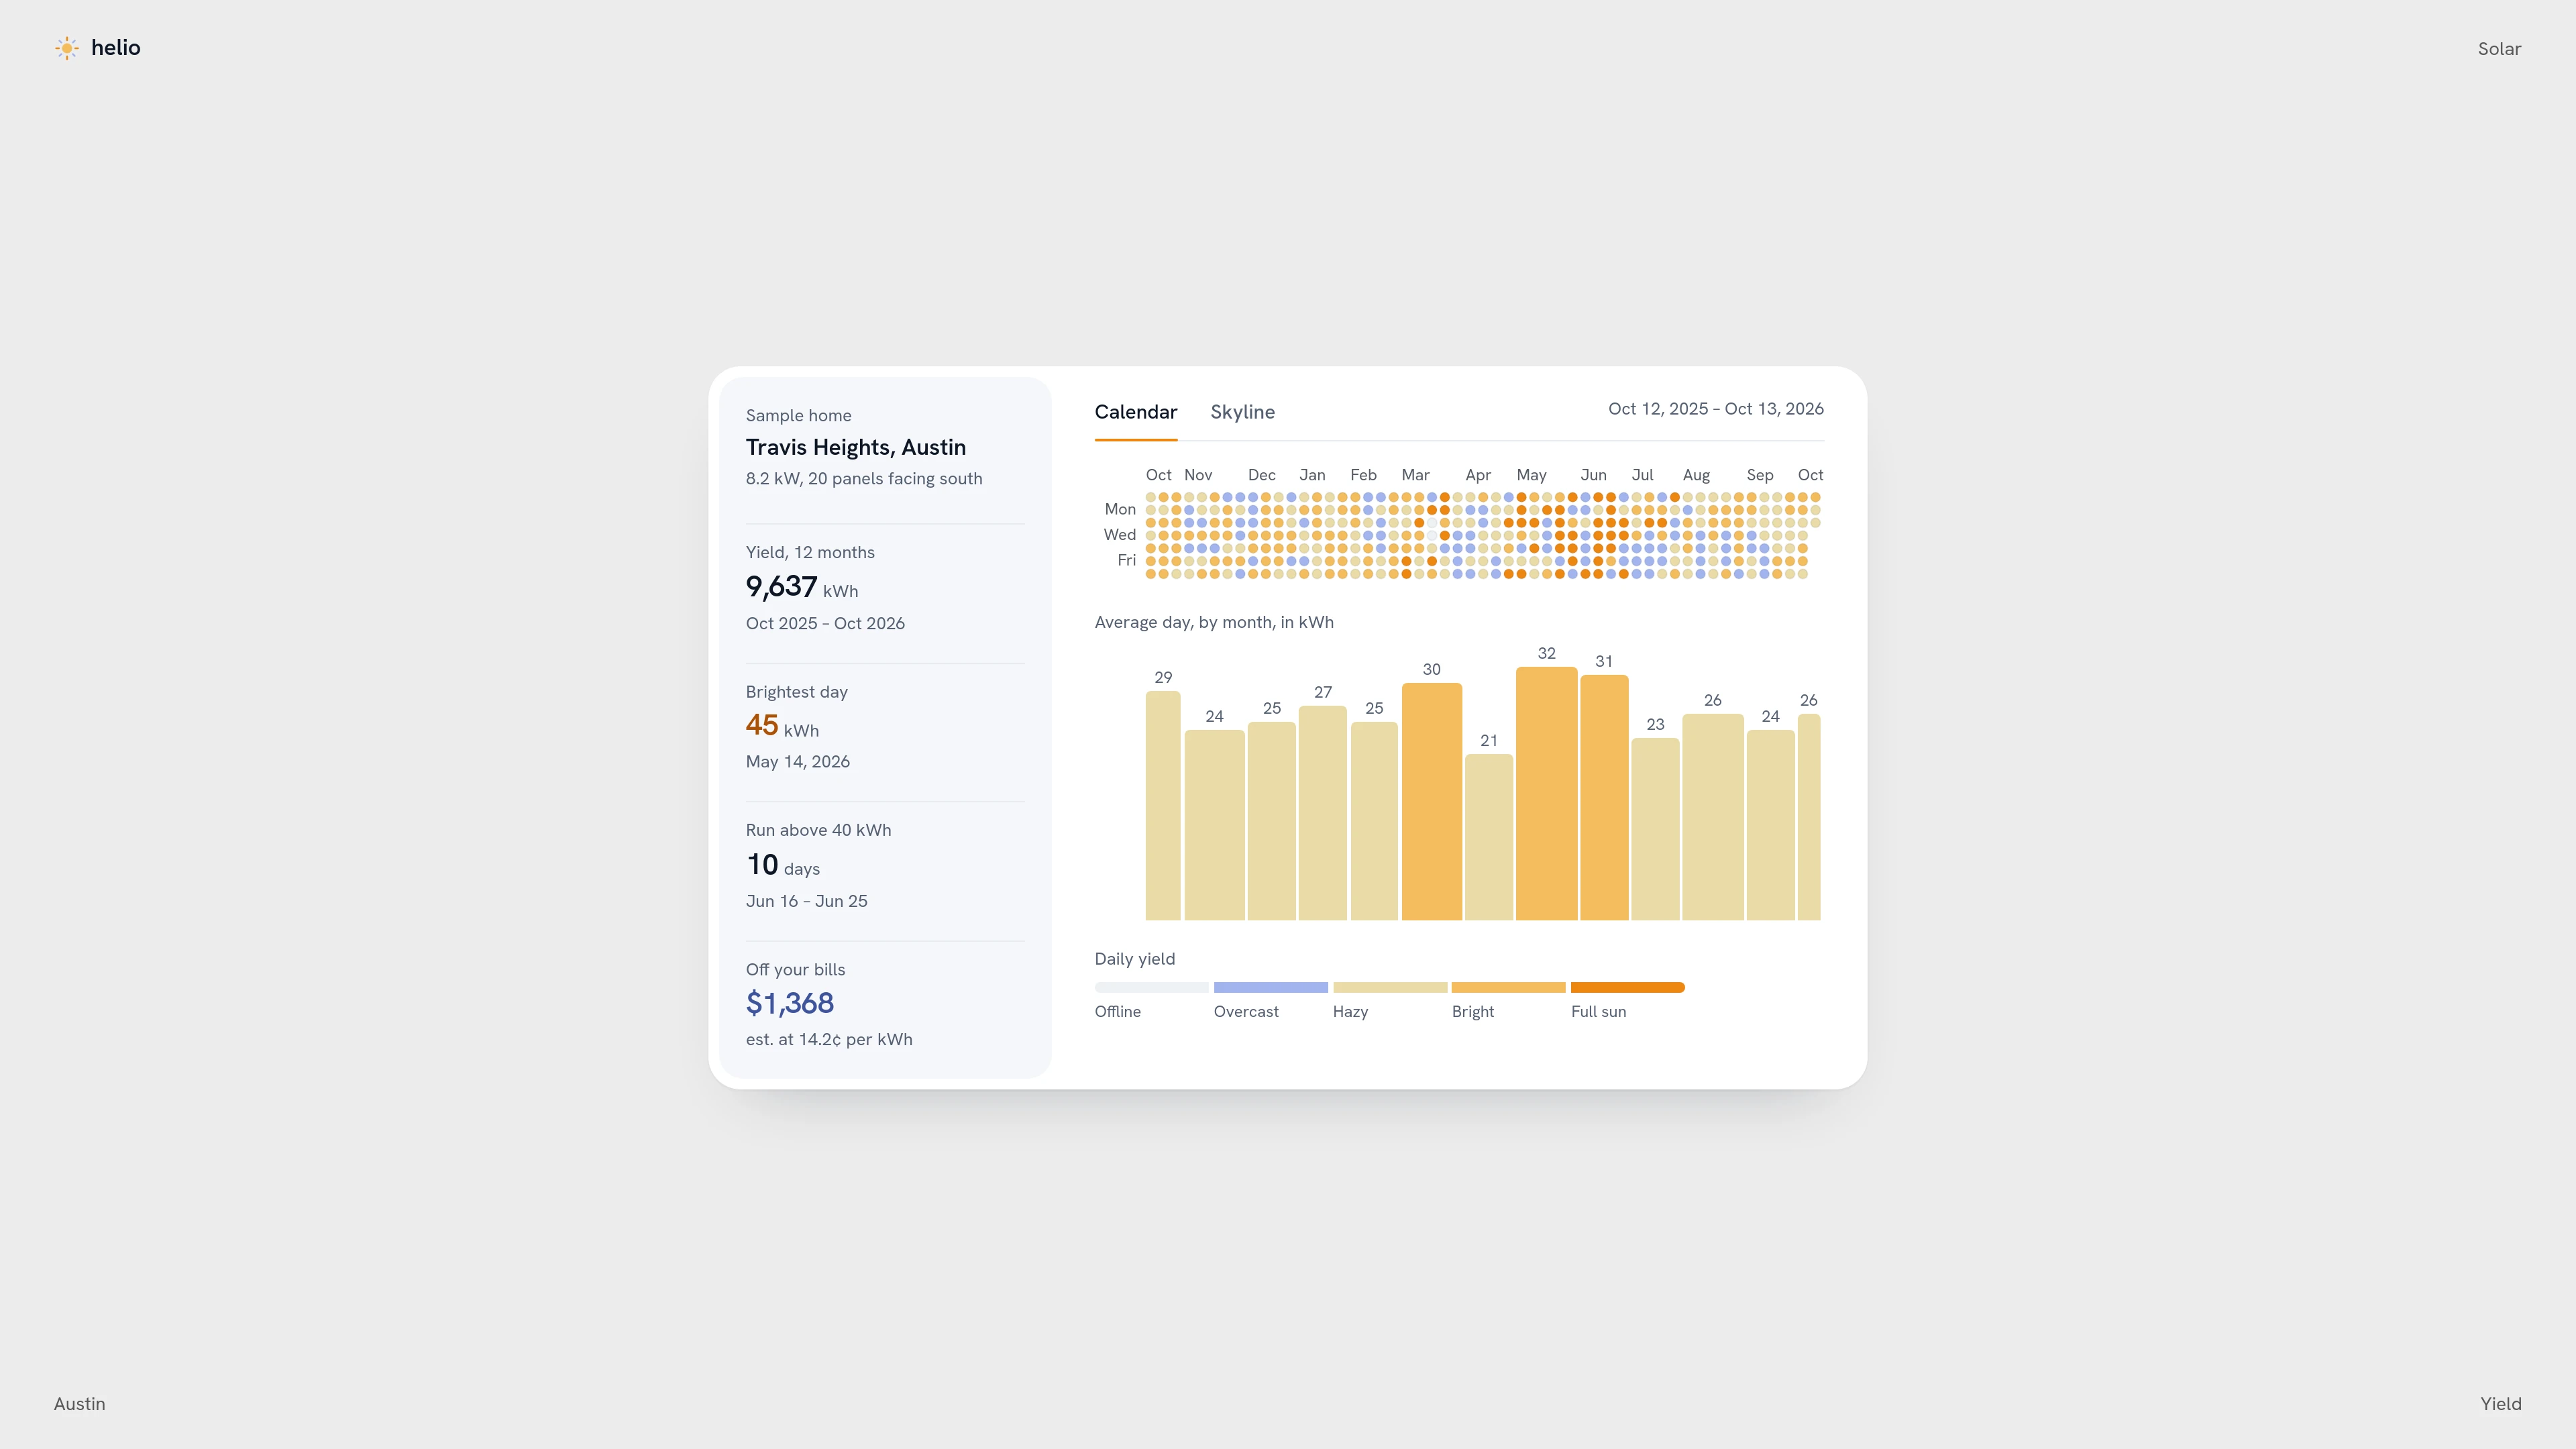
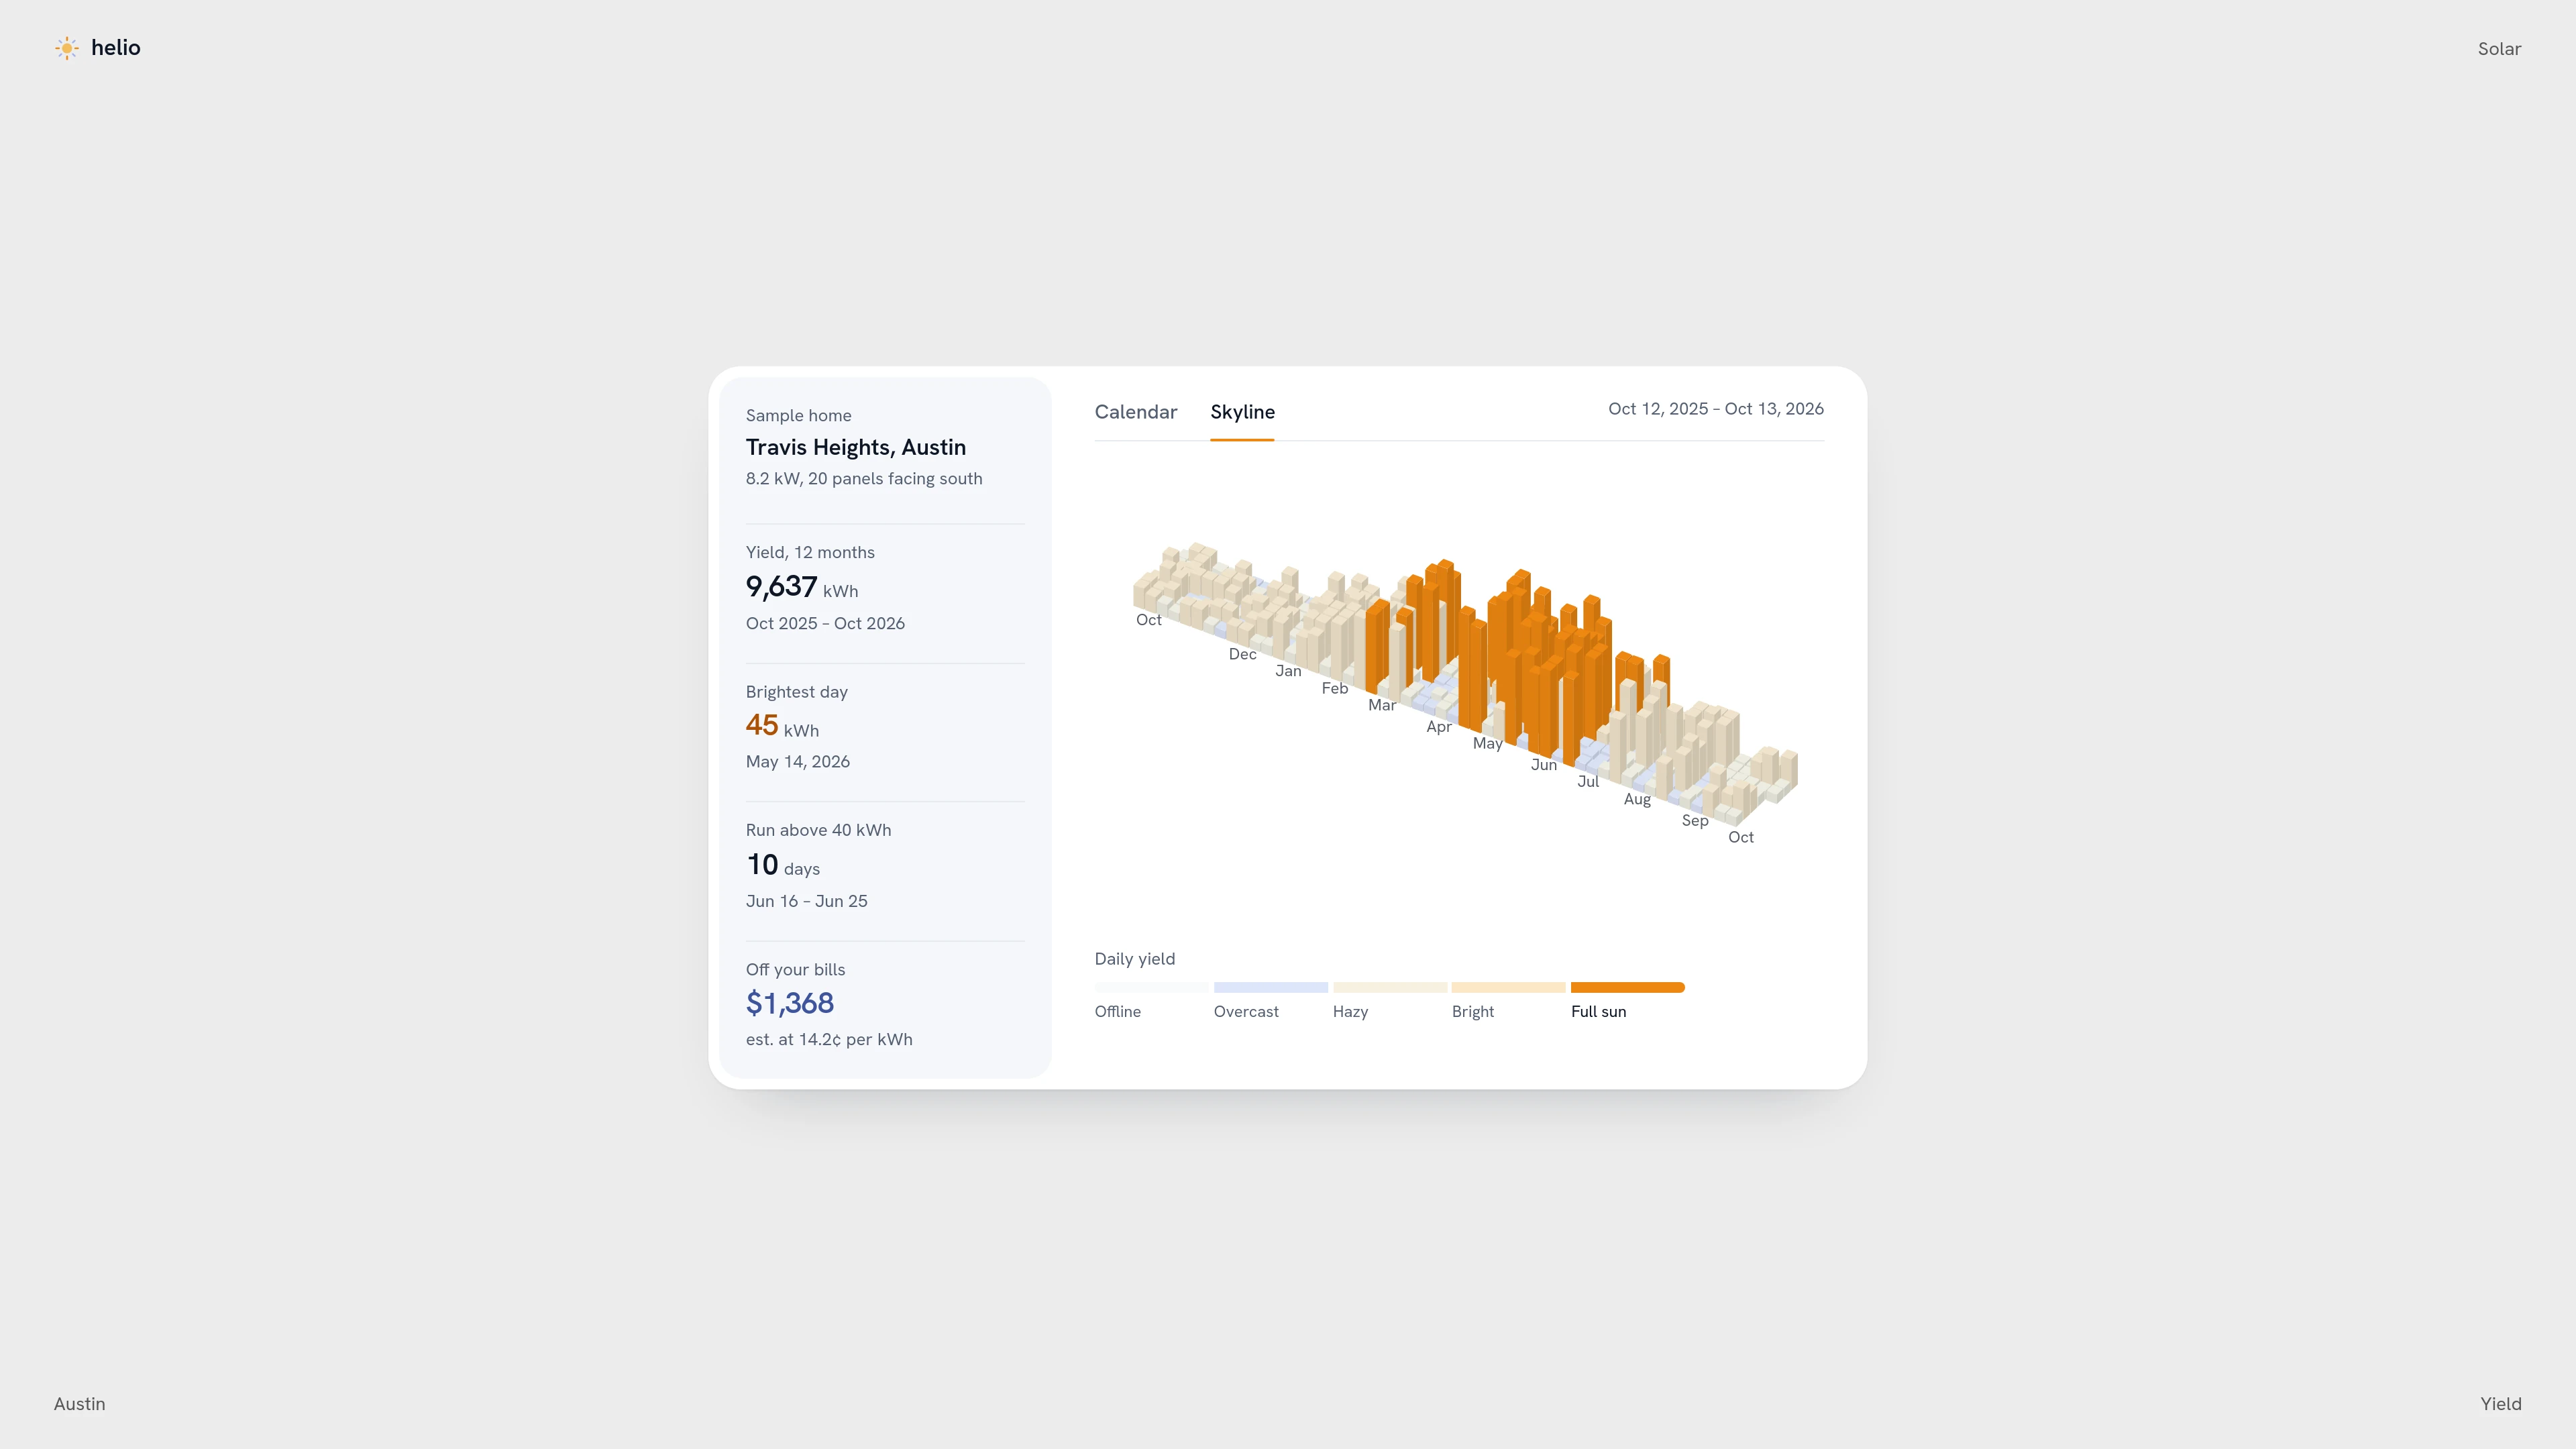
Helio is an activity calendar for solar energy. A year of daily yield from an 8.2 kW rooftop system shows as a calendar heatmap, one dot per day, with a bar for the average day of each month lined up under its columns. Switch to Skyline and the same days rise week by week into an isometric 3D skyline you can drag to turn. A summary column beside the chart rolls its figures in like an odometer: yield over 12 months, the brightest day, the longest run above 40 kWh and the estimated savings on the power bill. Hovering a band of the five-step legend, from Offline to Full sun, lights up only those days, and every day has a tooltip with its kWh, band and share of the best day. The chart is drawn on a 2D canvas with no chart or 3D library. Feed it your own { date, count } days and the bands, colors, labels and skyline shape are plain constants at the top of one file. It works with the keyboard (arrow keys walk the days, Escape clears the selection) and respects reduced-motion preferences. Included: the complete React, TypeScript and Tailwind CSS source as a standalone Vite project, the chart engine as its own reusable file, a seeded sample year, a README with run, customize and deploy notes, AGENTS.md and CLAUDE.md for AI coding tools, and credits, packaged as a private member download.
Highlights
- Production-ready, documented source
- Clean, componentized architecture
- Drops into your stack with minimal setup